Over the past month, our infrastructure has had some intermittent issues, so we wanted to drop a quick postmortem describing what the problem was and how we fixed it so we can solve these problems more quickly in the future!
Terminology
Before starting, we should define some terminology:
- Pod - one instance of a running application (ex. Penn Courses Backend)
- Node - a physical machine that our pods run on
- Cluster - a collection of nodes that our pods run on
- Kubernetes - a piece of software built to move pods among nodes such that nodes don't get overwhelmed (use too much CPU/RAM)
Background
For our cluster, we use AWS Spot Nodes. These are machines that may, at any time, be shut down by AWS for use in other places. In exchange for this, we pay a lower price for these nodes. Nodes going down is not a problem for us since we're running in Kubernetes which will automatically move our applications to our other nodes if one goes down.
When a spot node goes down, all applications (I'll use the word pods interchangeably) are moved to the other nodes. A new node is then brought up and the pods (hopefully) rebalance between the available nodes.
Additionally, a few weeks ago, we switched from many smaller nodes to 3 higher-resource nodes. This gave us some cost savings as fewer high-resource nodes are cheaper than many low-resource nodes.
Symptoms
Symptoms first appeared around the time of the Path@Penn launch.
We started getting reports of applications failing with no text in the browser other than Service Unavailable. This allowed us to immediately know that this was an infrastructure-wide issue for a few reasons:
- If multiple products are failing in the same way, then there cannot be a single-application code change that caused this. It must be that some part of the underlying infrastructure is broken.
Service Unavailableis an error that typically only our load balancer, Traefik will throw. It is almost never sent by actual application code.
Initial Debugging
Upon looking at the cluster with kubectl, we saw that many pods were stuck in the ContainerCreating state. This means that a pod has been assigned to a node, but for some reason, the node cannot start the pod up.
To debug this further, we looked at Datadog, our monitoring system. Datadog showed between 1 and 2 nodes at 100% CPU usage with the third sitting almost idle at ~10% usage.
At this point, the question becomes: If Kubernetes is balancing pods, why are some nodes at such higher resource usage than the others?
Deduction
After further investigation, it looks like the following was happening:
- A spot node gets scheduled to terminate
- All its pods are drained to the other two nodes
- The remaining two nodes don't have enough available resources to host all our pods and spike to 100% CPU usage
- 100% CPU usage renders the two nodes unusable, and they stop responding to both Kubernetes and Datadog.
- Even when the third node comes back online, pods cannot be rebalanced to it because the other two nodes are unreachable due to load.
The underlying cause of this issue is that while 3 nodes is enough for our cluster, 2 is not. When a spot node termination happens, we don't have enough resources to handle the load, and it creates a cascading failure throughout our infrastructure.
Solution
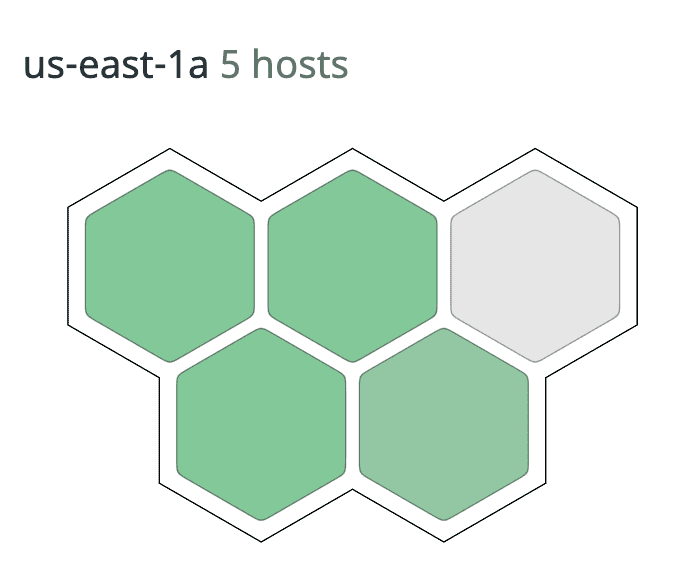
To solve this issue, we've scaled our cluster up to 5 nodes. This should mean that even if we lose a node due to spot lifecycle, we've got plenty of compute to handle things.
Why did this just happen now?
This is the main question we've been asking ourselves. Intuitively, it seems like we should have run into these issues as soon as we switched to only using 3 nodes.
However, these issues are not just a symptom of having 3 nodes. They're a symptom of having 3 nodes while under high load. The Path@Penn launch was the first time we had high load on our products since moving to 3 nodes. Therefore, while this problem existed all along, we didn't notice it until our systems were under stress.
Next Steps
To solve these issues more quickly in the future, we should have better alerting and monitoring around application failures. Specifically:
- Alerting when we have a high number of
503 Service Unavailableresponses. These almost always indicate an infrastructure-level error. - Alerting when we have high node CPU usage. While pod CPU usage hasn't been great signal for us (pods occasionally spike), high node usage almost always indicates a problem.
Reach Out
If any of this looks like it's up your alley or you wanna learn more about our mission, be sure to email us at contact@pennlabs.org or apply to be a part of Labs! We've got some fantastic teams working on interesting problems with a direct impact on campus.