This article was originally posted here.
TIMELINE Feb - Nov 2019 (10 months)
ORGANIZATION Penn Labs
TEAM Davis Haupt (Team Lead + Developer), Ying Xuan Eng (Developer), Daniel Like (Developer), Shaya Zarkesh (Developer), Daniel Tao (Developer), Charley Cunningham (Developer), Daniel Ng (Business Developer)
MY ROLE User Research, Experience Design, Interface Design, Visual Design
TOOLS Sketch, Zeplin, Figma, Illustrator, HTML/CSS
BACKGROUND Designing for the Courses team, I work closely with developers to build products that streamline course registration for students.
In 2017, Penn Labs acquired Penn Course Search, a former Penn student’s side project. At the start of 2019, we initiated a complete interface redesign, back-end rewrite, and rebrand of the product as Penn Course Plan. In October 2019, we launched Penn Course Plan in time for Spring semester course registration.
As the only designer for this project, I was responsible for discovering user needs, designing the new interface, creating a style guide and component library, and handing off detailed mockups to developers.
The Problem
Course registration is a complicated and tedious process.
When students plan their courses for the upcoming semester, there are many important factors to consider. However, pertinent information is decentralized across many resources.
The university’s course planning software Penn InTouch is notoriously difficult to navigate and forces students to reference external tools. Penn Course Search addressed some of these shortcomings, but fell short on critical features and user friendliness.
Penn undergraduates need a more comprehensive and intuitive course planning tool to simplify the complicated course registration process.
Approach

Solution
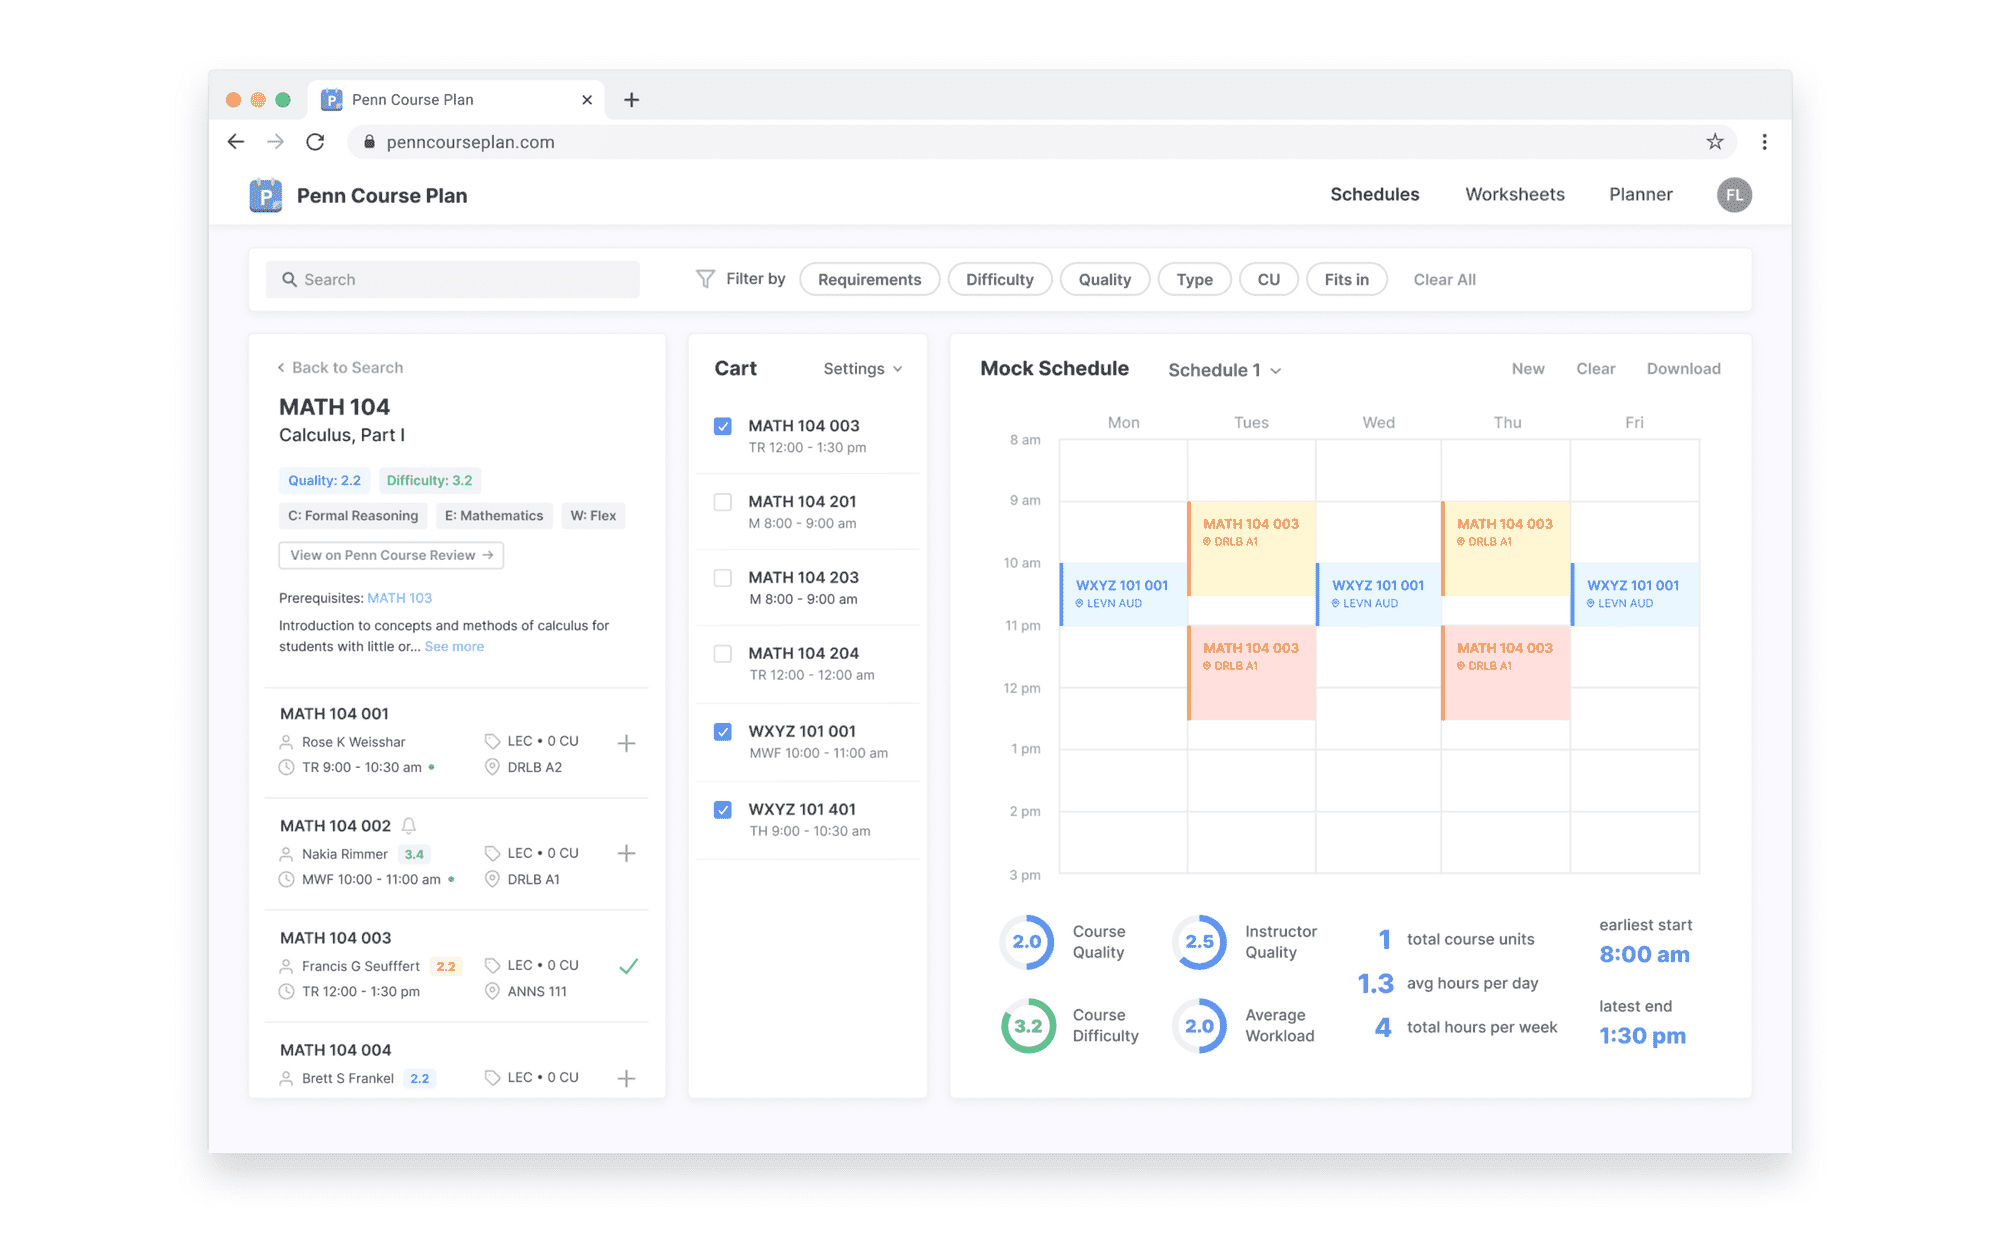
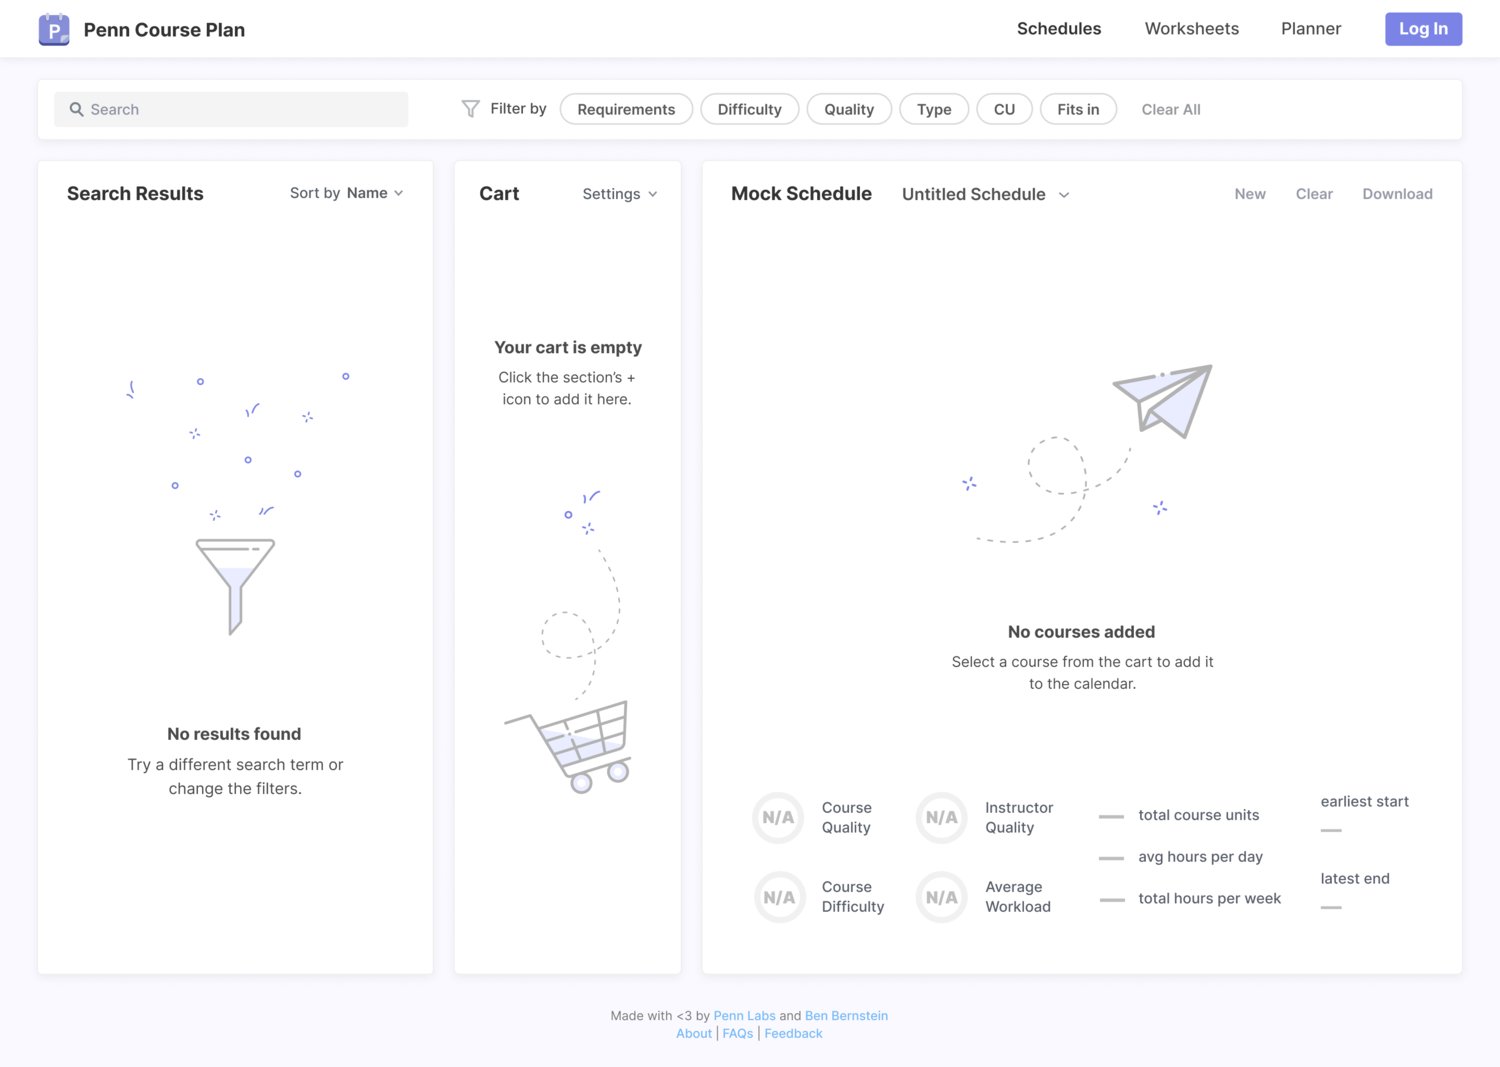
We built Penn Course Plan, a web app that allows students to find and plan their courses for the upcoming semester, combining a comprehensive course search with a simple mock scheduling tool.
Penn Course Plan aims to help students feel more informed and confident when choosing courses, while efficiently and intuitively creating mock schedules.
Search for courses and create mock schedules
Look for courses to take next semester and keep your options in your course cart. Plan your schedule by adding courses from your cart to multiple mock schedules.
Filter and sort search results
Efficiently find classes that fulfill general education requirements and double count. Additionally, filter by quality, difficulty, course units, and type. Sort classes by difficulty and course quality.
View relevant schedule statistics
Get an overview of each mock schedule with average quality, difficulty, and workload. Manage your time with stats on total credits and hours of class time.
Research
DEFINING TARGET USERS
Who are we designing for?
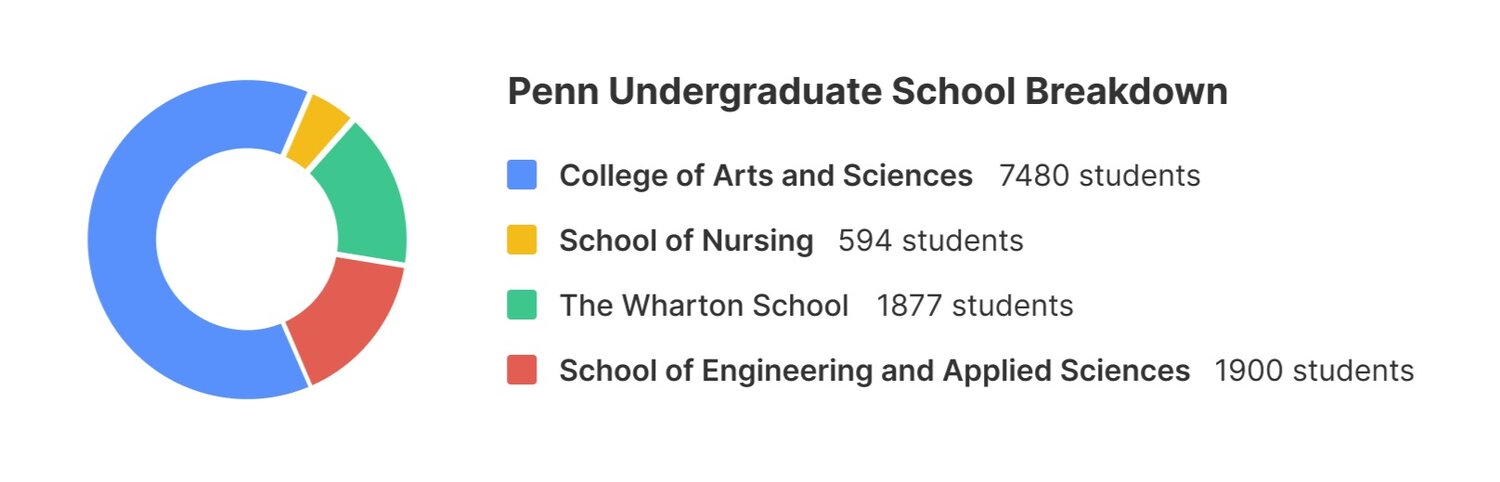
Considering the immense diversity among the 10,000 undergraduate students at Penn, it was important to identify subgroups within the population to understand their unique needs, motivations, and pain points.
Penn has four individual undergraduate schools.
 Coordinated and uncoordinated dual degree programs (multiple schools) are not uncommon at Penn.
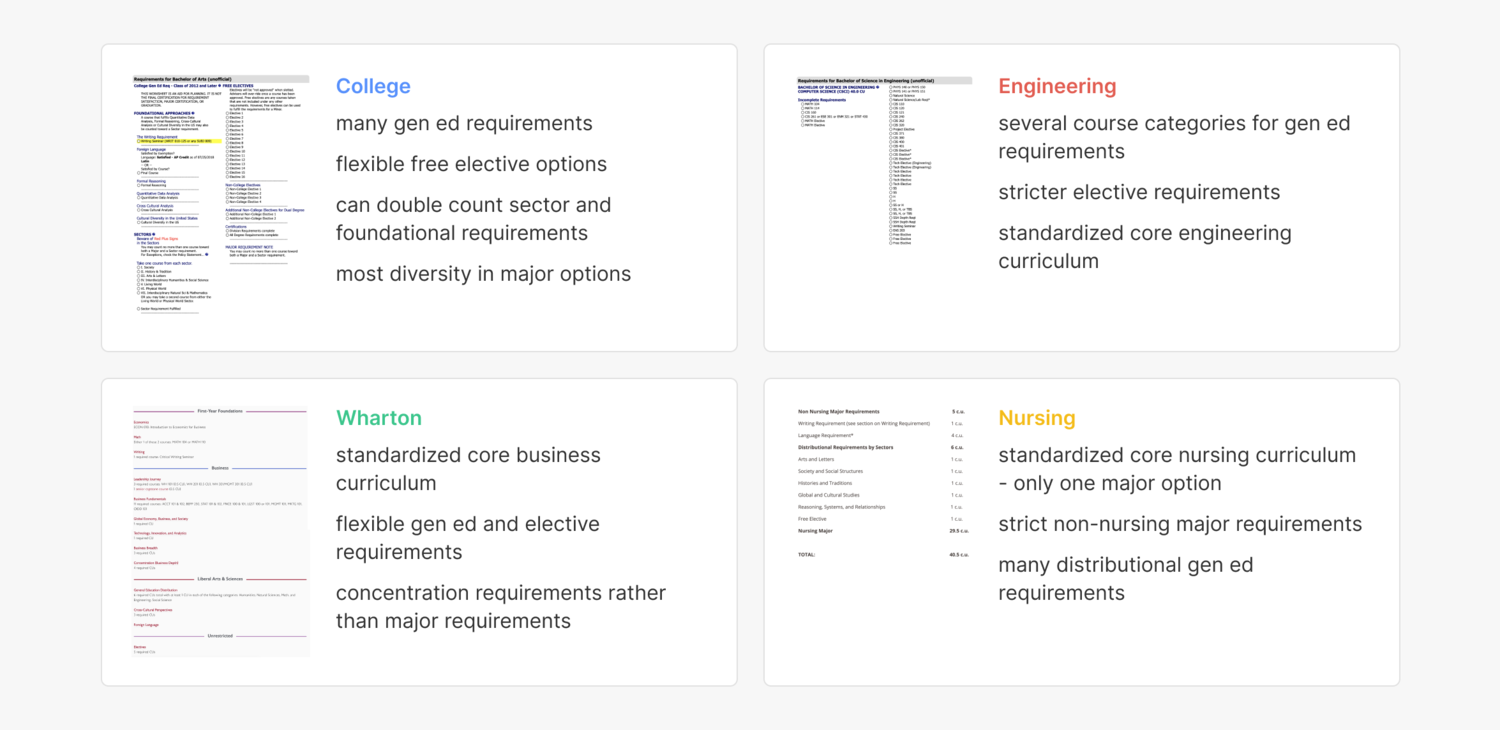
 While all students choose from the same course offerings, each school has their own graduation requirements.
Additionally, course planning considerations vary significantly between freshmen, sophomores, juniors, and seniors.
You are not your user
At Penn Labs, products are built for students by students. While acting as everyday observers of campus life makes it easier to empathize with our target audience, it poses its own challenges.
It was quick and convenient to test and gather feedback from Labs members at each step of the process, making it easy to fall into the trap of assuming that we are representative of the target audience. This would be a dangerous assumption, since our members tend to be more tech savvy and motivated to use our products than the average user.
Throughout the redesign process, I made an effort to frequently gather feedback from and conduct usability tests with a broad spectrum of users to obtain authentic and unbiased feedback.
USER RESEARCH
Talking to People
I talked to many students across several demographics, including graduation year, school, intended field of study, and familiarity with Penn Courses products.
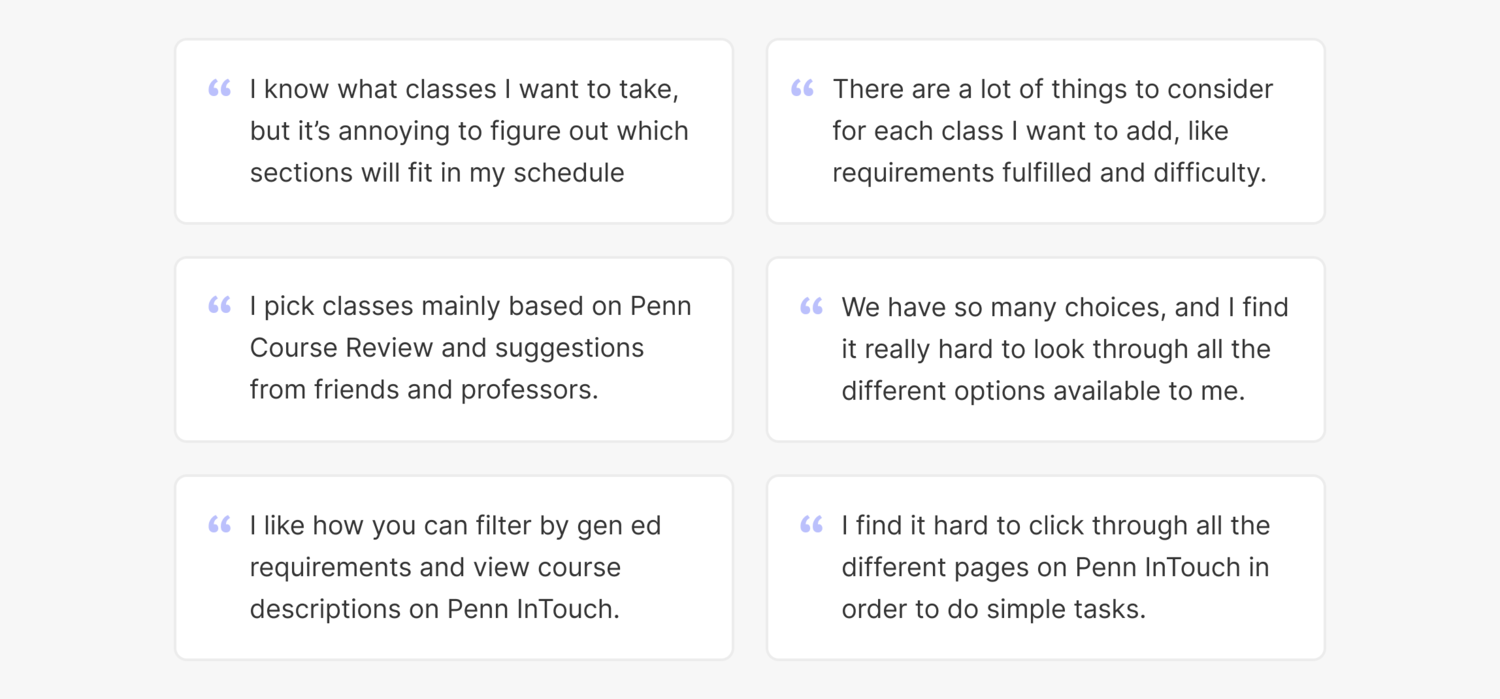
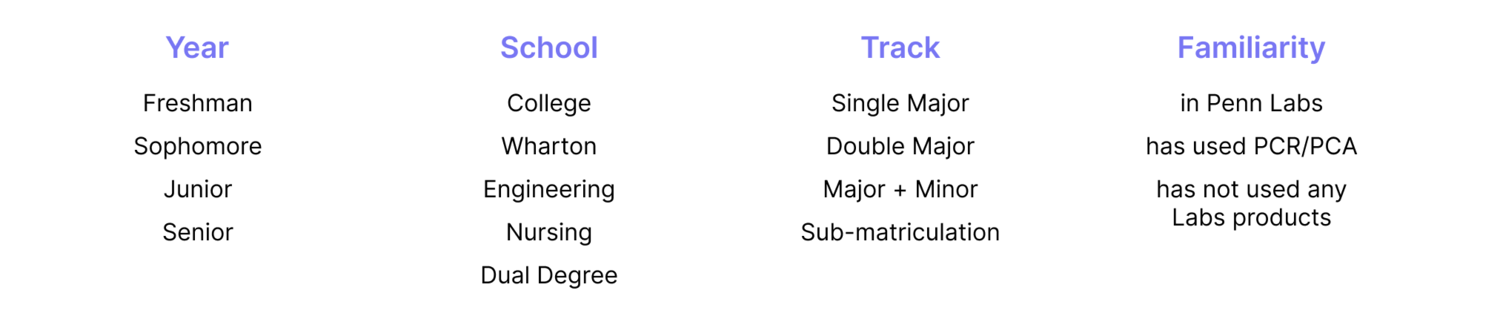 The general interview protocol involved asking questions that would help me understand how students currently plan their courses and what problems exist in the process.
- What factors do you consider when deciding what classes to take?
- What resources do you reference when you’re planning your schedule?
- What’s your process for creating a mock schedule?
- What’s your biggest challenge when planning courses for next semester?
- What are the most helpful and frustrating features on Penn InTouch?
Synthesizing Online Data
To better understand student needs, I analyzed the different curriculums and graduation requirements for each undergraduate school using their course planning worksheets. I synthesized the results into key findings for each school.
 I also gathered comments about Penn InTouch from students who expressed their criticisms in the Daily Pennsylvanian and a published document by the Student Committee for Undergraduate Education.
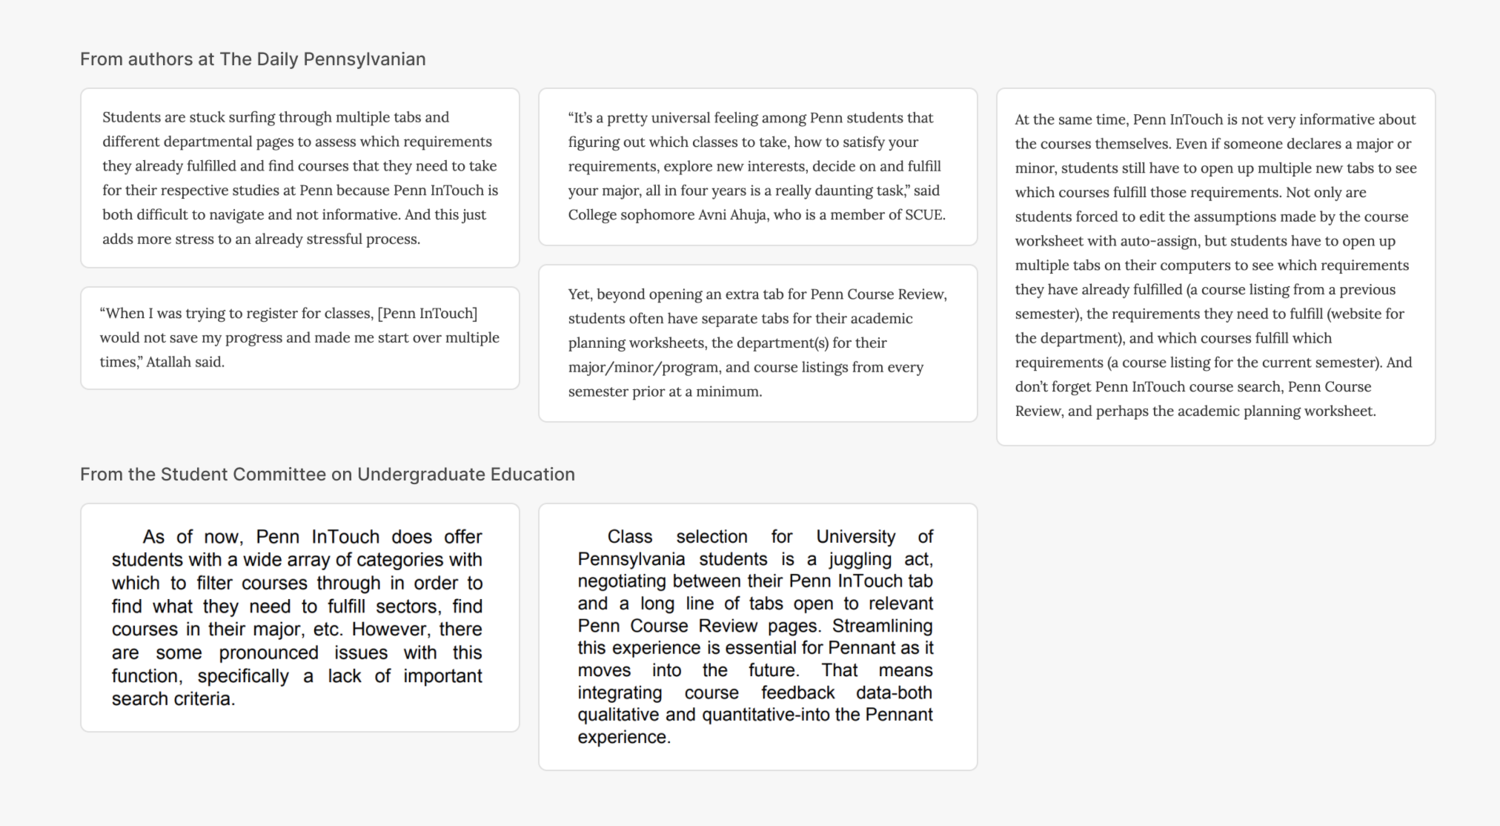 I found that students were frustrated by the inconvenience of navigating to multiple tabs to find the information they needed. There was also** lack of trust** in the software due to the outdated interface and the buggy experience.
Key Findings
Taking note of the patterns that emerged from the various research methods, I identified the following pain points in the course registration process:
- Students take many factors into consideration when constructing their schedule, but all the information they need is spread across many different sites and tools.
- Penn offers thousands of classes, and students have trouble narrowing their choices.
- Students are unsatisfied with the current resources (Penn InTouch and university academic advising) but some are unaware that other resources exist.
- It’s tedious to build mock schedules on Penn InTouch because searching for courses and viewing them in mock schedules requires toggling between multiple pages.
Because of these difficulties, course planning as it stands now is frustrating and stressful process.
IDENTIFYING NEEDS
Crafting User Personas
From the research, I constructed a few personas to represent target user groups and explored their needs, frustrations, and end goals.

Establishing Design Goals
With the user research insights and personas in mind, I worked with my team todecide which user pain points and business goals to tackle before the October launch. Here are the primary goals we decided upon:
- Enable users to effortlessly and efficiently access the data they need to construct an informed course plan.
- Make it easier to find classes by designing an intuitive, unintimidating course search experience
- Structure the site in a way that seamlessly bridges the course search and mock schedule functionalities.
- Create a visual style guide and component library that dictates interactive states and technical specifications for developers.
If the goals have been met, we can help users feel more informed and less stressed while planning out the next semester and integrate Penn Course Plan within the Penn Courses ecosystem.
Ideate
EXISTING SOLUTIONS
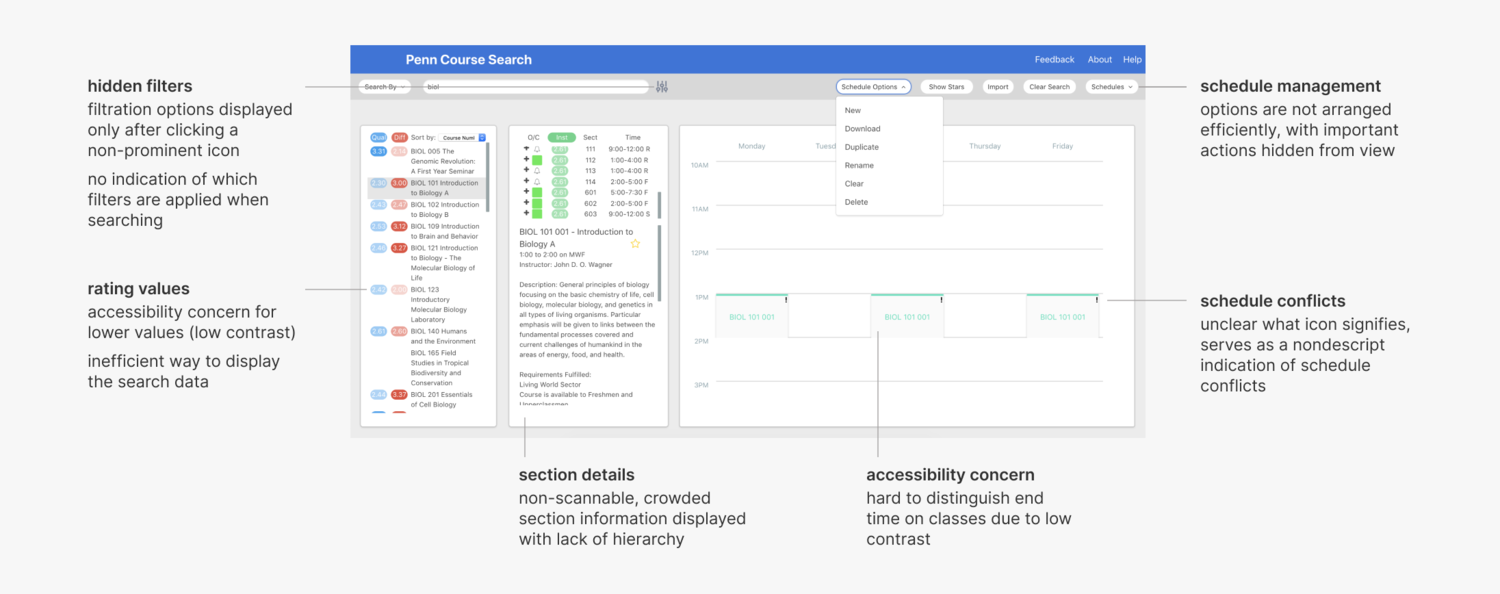
Auditing the Current Version
With what I learned about our users, I determined what features from Penn Course Search to keep, improve, create, or get rid of.
- Keep layout order. Search, results, then schedule is a logical order to users.
- Improve search filtration. Filters are hidden from the default display and applied filters are not displayed upon search.
- Improve schedule hierarchy. Organize arrangement of schedule management actions. Display courses on the calendar in an accessible manner.
- Improve display of search result. Make section details scannable. Find an accessible and efficient way to visualize rating values.
- Add more filtration capabilities. Incorporate highly requested filter options (i.e. quality, difficulty, time, credits).
- **Add schedule statistics. **Display data visualizations of that provide statistical overviews of mock schedule difficulty, quality, workload, and time.
- Remove underused features. Import schedule and filter by special programs required lots of technical resources and were used by less than 2% of users.
Competitive Analysis
Penn InTouch
I first took a look at Penn InTouch, the university software that all students currently use to search for and plan their courses.
 adding a course to my mock schedule on PennInTouch
The main pain point of building schedules in PennInTouch is the need to toggle between multiple pages (‘Course search’ and ‘My mock schedules’) when creating the mock schedule.
Users must search for courses on the search page, add the courses they would like to put in their mock schedule to the course cart, then switch to the mock schedules page to add courses from the cart to the mock schedule.
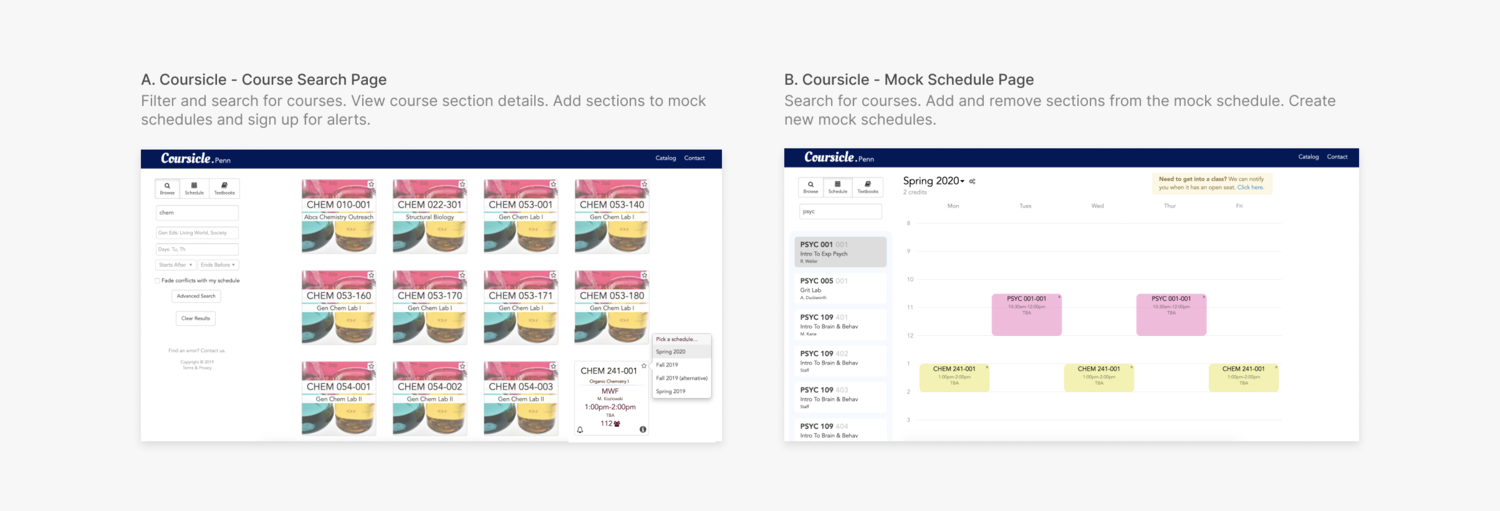
Coursicle
Because the university’s software Penn InTouch fails to address key user needs, students have turned to non-university affiliated options. Penn Course Plan’s direct competitor is Coursicle, a site that features course catalogues and schedule builders for hundreds of universities.
While Coursicle’s objective is to provide a “less stressful” and “more modern” alternative to “slow, unintuitive, and ugly online systems,” it falls short in delivering user-friendly interactions and comprehensive course data.
 Pros:
Pros:
- sleeker interface than Penn InTouch
- enables efficient management of multiple mock schedules
- side by side placement of search results and mock schedule
Cons:
- separates course search and schedule creation onto two different pages
- contains two separate mechanisms for adding courses to the schedule
- lacks sufficient information about courses and sections
- missing critical course filtration functionality
- poor hierarchy in search results and course details
Because Coursicle services so many universities, it does not address the specific needs of Penn students. I summarized the main opportunity areas that Penn Course Plan can address:
- Search and schedule are still on separate pages, requiring the same frustrating toggling behavior as Penn InTouch.
- Critical information that students take into account when deciding upon courses, such as student reviews and course descriptions, are not displayed. Additionally, there are no warnings for co-requisite sections.
- Search filters are not comprehensive. The filters only cover general education requirements for College students, missing Engineering/Wharton/Nursing students.
- The search results are cluttered and do not display information students care about hierarchically.
BRAINSTORMING
Ideating Features
After establishing the design goals and gaps in existing solutions, I brainstormed ideas to address those gaps with my team, prioritizing based on importance to users **and feasibility**.
Working with Constraints
By talking to developers during ideation, I was able to uncover technical constraints and compromise early on. We determined which features were feasible to implement before our launch, which were feasible to implement eventually, and which were not feasible at all.
We settled on the following major features for the initial redesign:
- **Course search: **Search for courses by course name, department, and professor. Sort search results.
- **Search filters: **Keep existing filtration capabilities. Incorporate filters that rely on Penn Course Review data and compatibility with the existing schedules.
- Section details: View course section details in scannable table cells. Add sections to the cart.
- Course cart: Store course sections in the cart to be added to multiple mock schedules.
- **Mock schedules: **View course sections in calendar format. Manage (create, copy, and delete) schedules.
- Schedule statistics: View relevant data that gives an overview of mock schedule parameters.
Some features that we** eventually hope to implement** include:
- Filter by major: Major requirements are housed on each department’s website, and are not formatted consistently across departments. This makes it difficult to implement this feature without extensive manual input.
- Academic worksheets: Academic worksheets on Penn InTouch are customized course checklists based on a student’s chosen academic plan. However, because these checklists are based on major requirements.
- User accounts: Penn Course Plan is now moving all its products towards an accounts system to save user information in their PennKey login.
These features were tricky to deal with, since I had to keep their potential entry points in mind while laying out the initial interface.
Design
SKETCHES AND WIREFRAMES
Crafting the Layout
I started the design process by sketching to explore the layout and placement of several features. I collected qualitative feedback from my team members and other students throughout this stage.
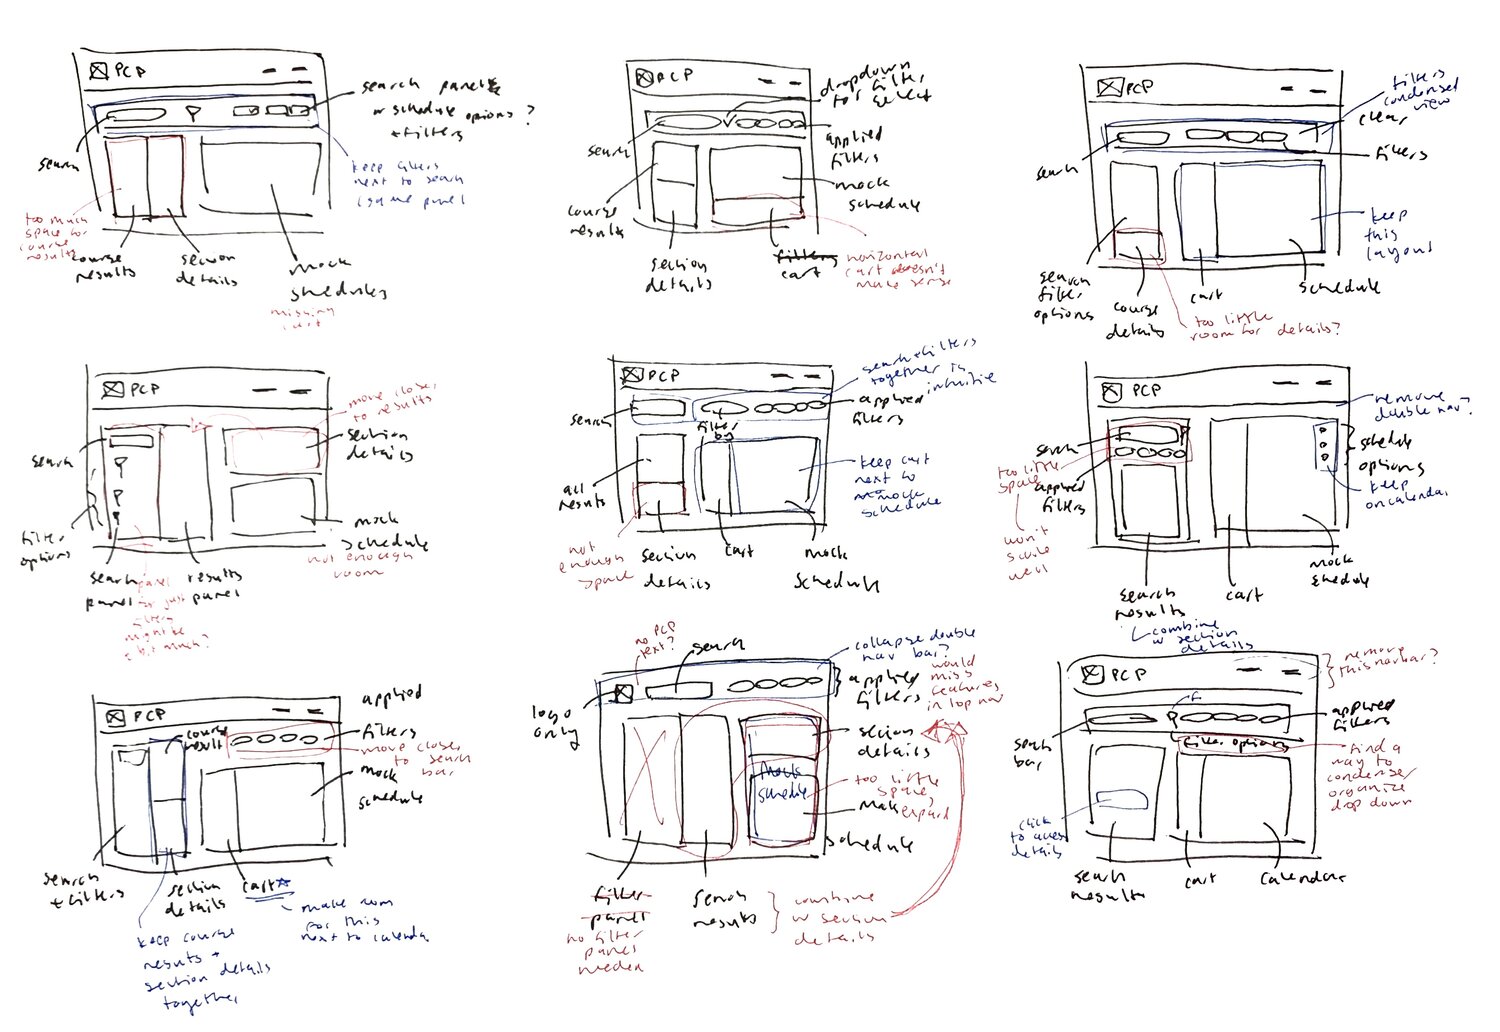 After receiving feedback on these initial explorations, I made the following design decisions concerning the layout:
- Keep the course search on top, but separate it from navigation, to group it visually with the sections below.
- Combined the search results with section details to reduce redundant information and make room for a course cart.
- grouped the schedule management functions with the mock schedules.
I then created mid-fidelity wireframes to finalize the layout to determine where the search filters and academic worksheets would go.
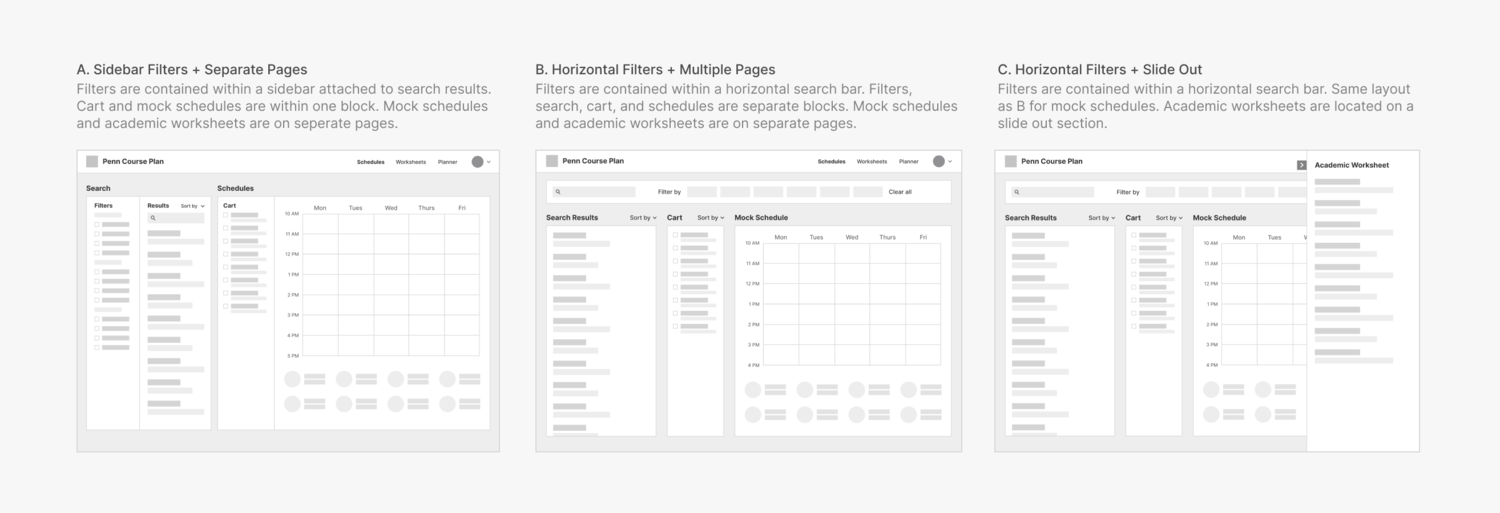 A features a search section (filters, search results) and a schedules section (cart, mock schedules). While organized simply, I found it difficult to make responsive without dramatic changes.
B is more modular, with separate search, results, cart, and schedules sections. The layout is more complex than A, but the flow remains intuitive.
C retains the layout of B, but features worksheets on a slide out section. While this allows users to use the worksheet while viewing the other functions, it limits the amount of space available for the worksheet features.
I settled on B, since the tabbed navigation allows for more flexible feature additions than C and the modular layout is more responsive than A.
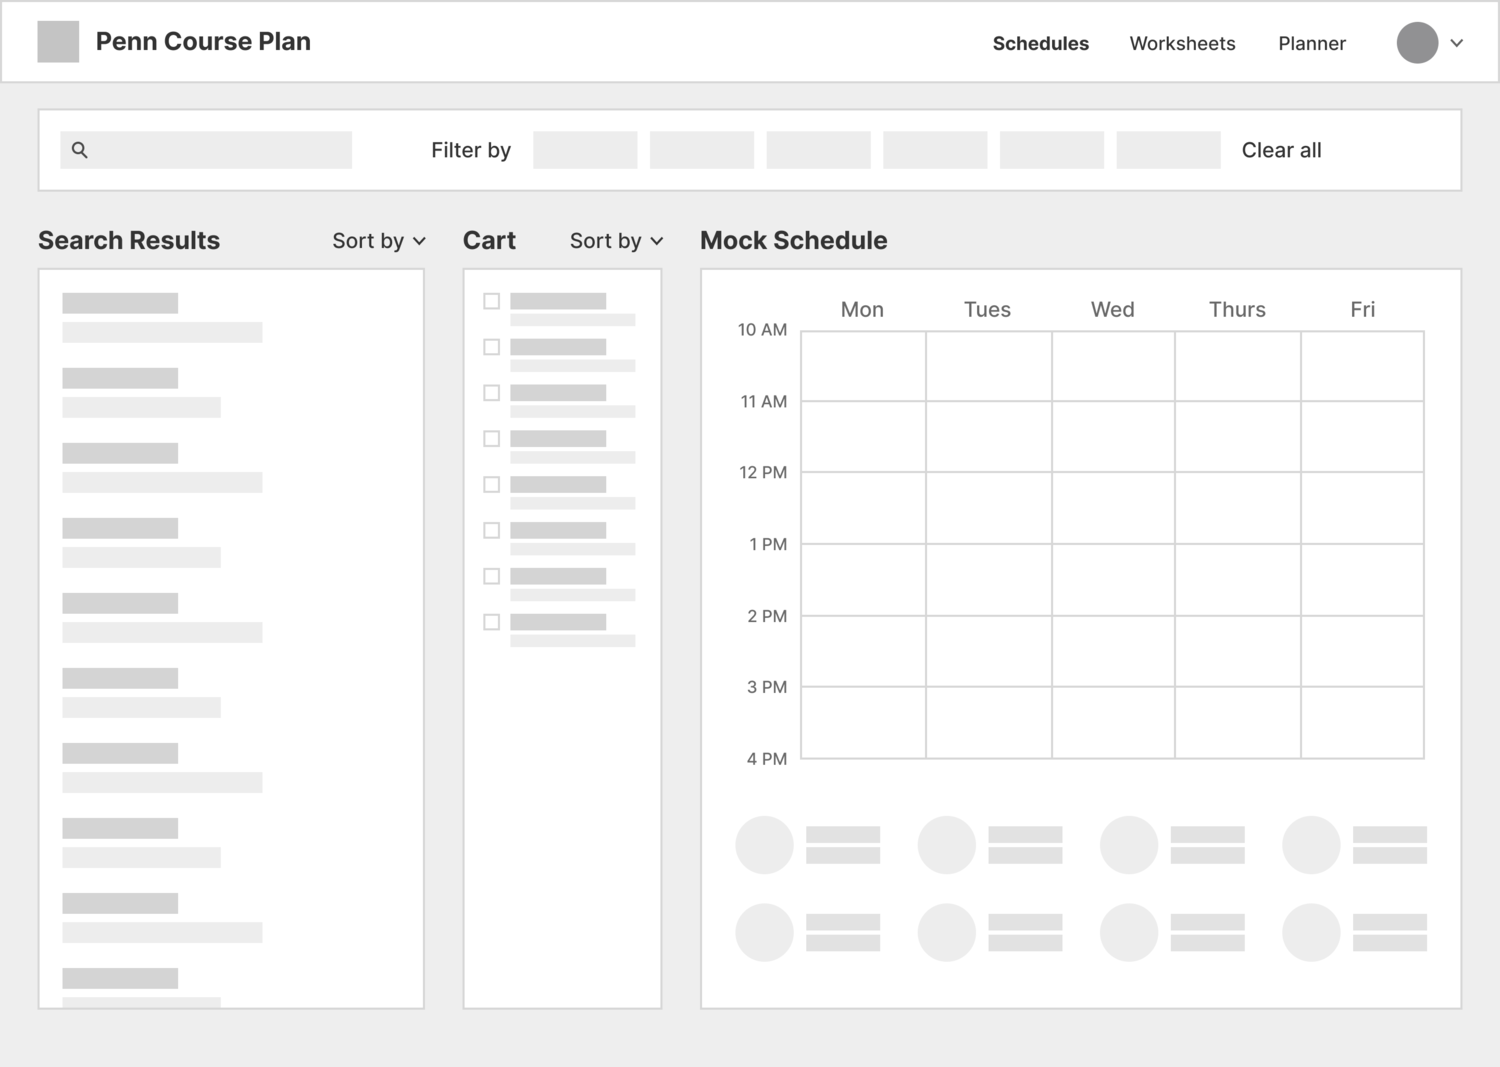 After deciding on B, I began exploring the individual features in more detail.

DEEP DIVES
Search Filters
In the current interface, search filters are hidden from the default display and applied filters are not displayed upon search.
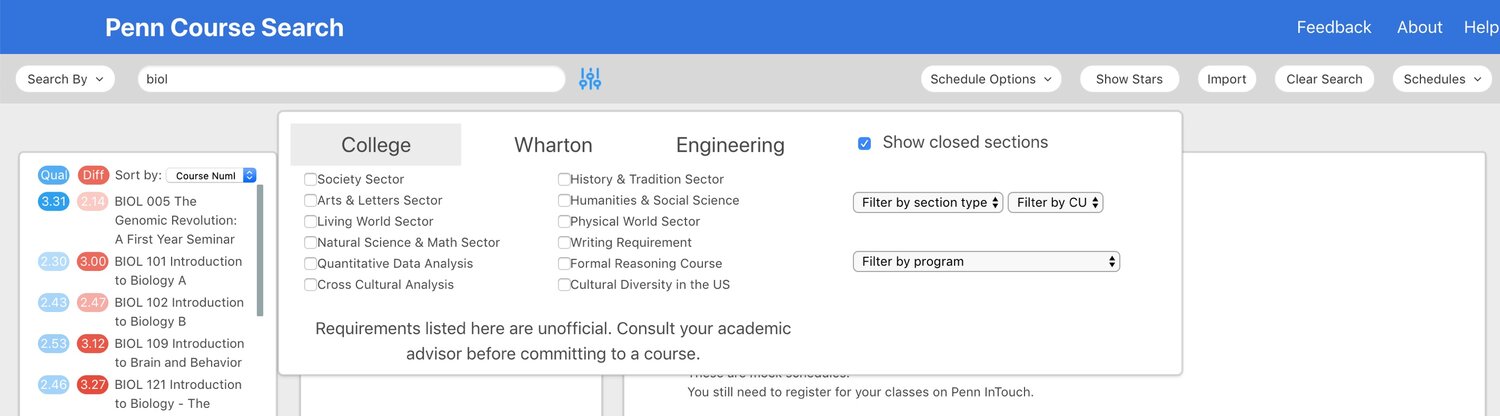 By observing users, I learned that this interaction caused confusion when filters that were applied earlier yielded empty search results. This confusion led to frustration and lower trust in the course search feature.
Determining structure
First, I explored two ways to increase the visual prominence of the filters: a vertical sidebar and a horizontal toolbar.
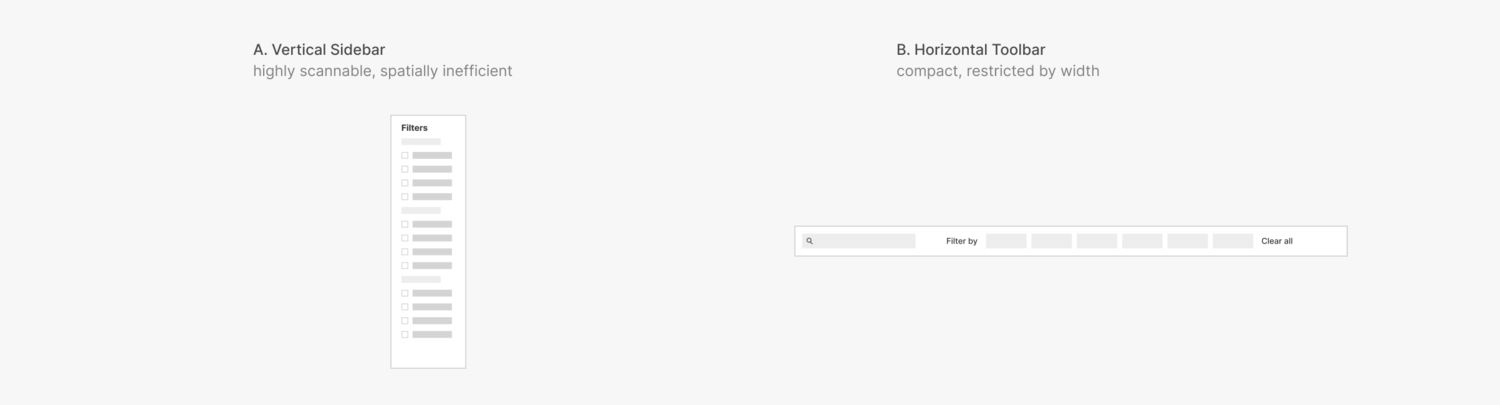 A is easier to skim and unrestricted by page width. However, I found that seeing all the filter options at once is not helpful enough to users to justify the amount of space the sidebar requires.
I decided on B, since it increases visibility of filter options in a compact and easily discoverable manner.

Defining interactions
I studied the way products like AirBnB and Google Fonts handle search filtration interactions. I found that distinctive interaction states were essential for creating an intuitive search experience.
AirBnB replaces category labels with selected values. With this design, users can see exactly which filter values are selected. I experimented with this approach for Penn Course Plan’s filters.
 AirBnB replaces category labels with selected values. With this design, users can see exactly which filter values are selected. I experimented with this approach for Penn Course Plan’s filters.
 However, I learned that this would not work for several edge cases, such as multiple long category values and categories with the same value types.
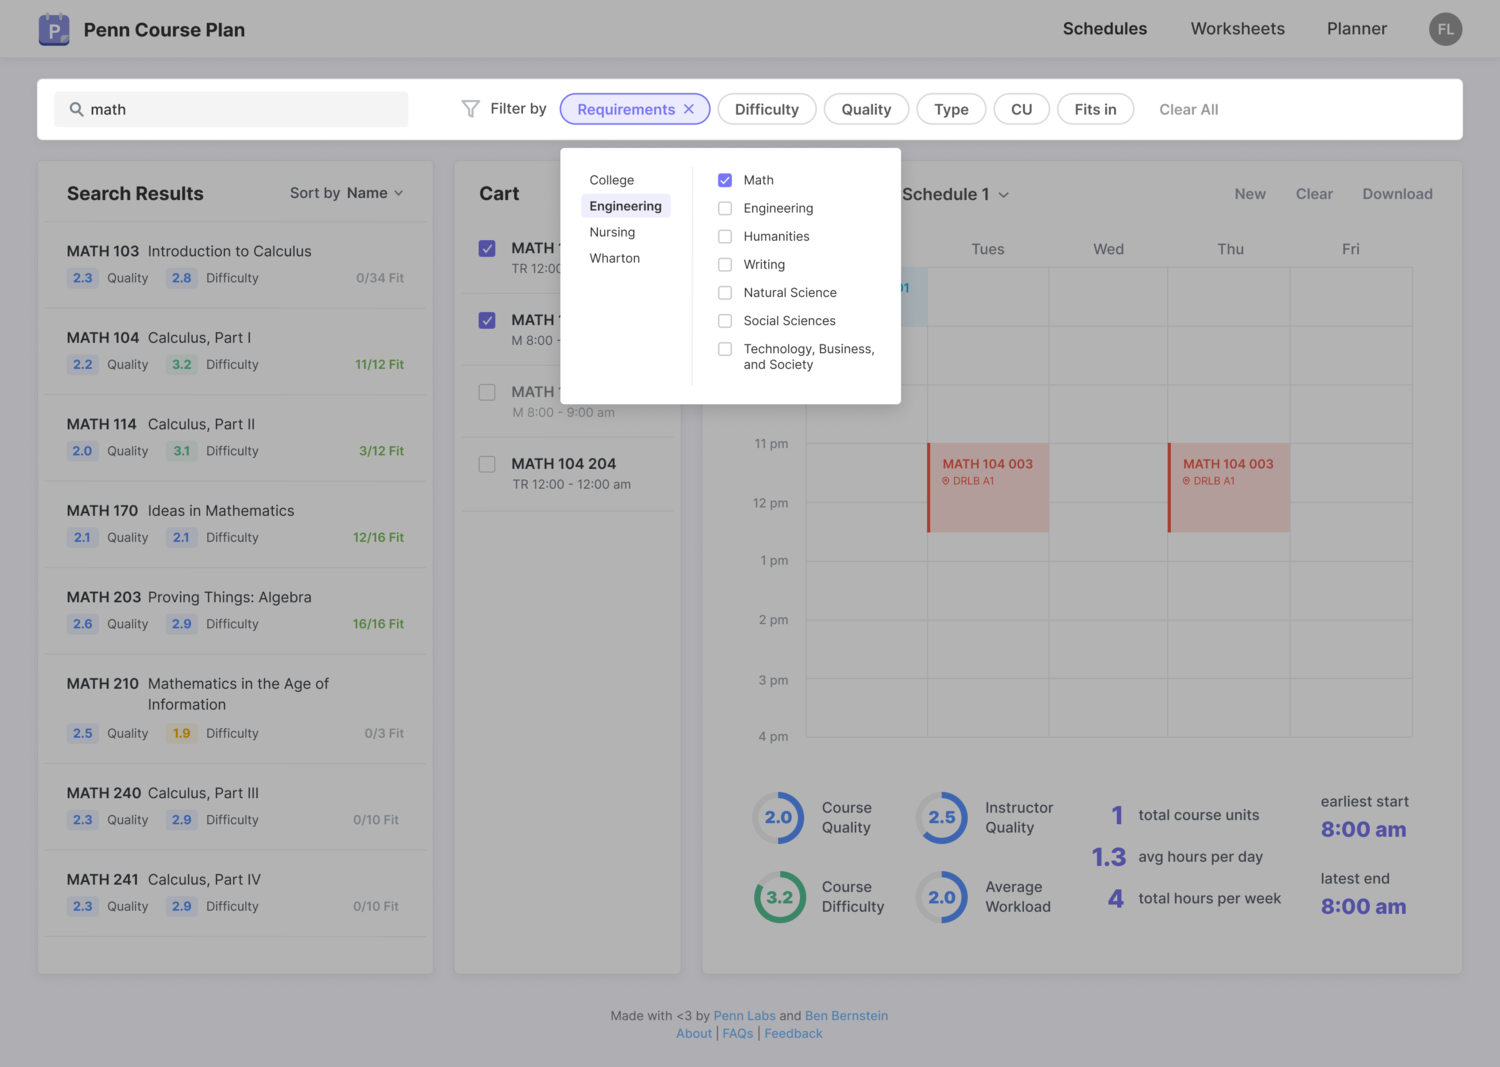
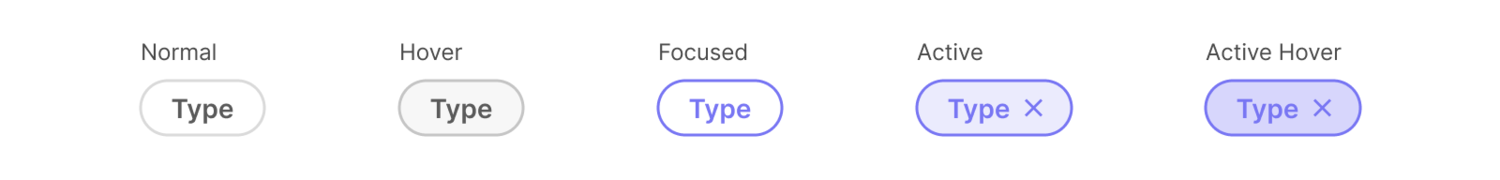
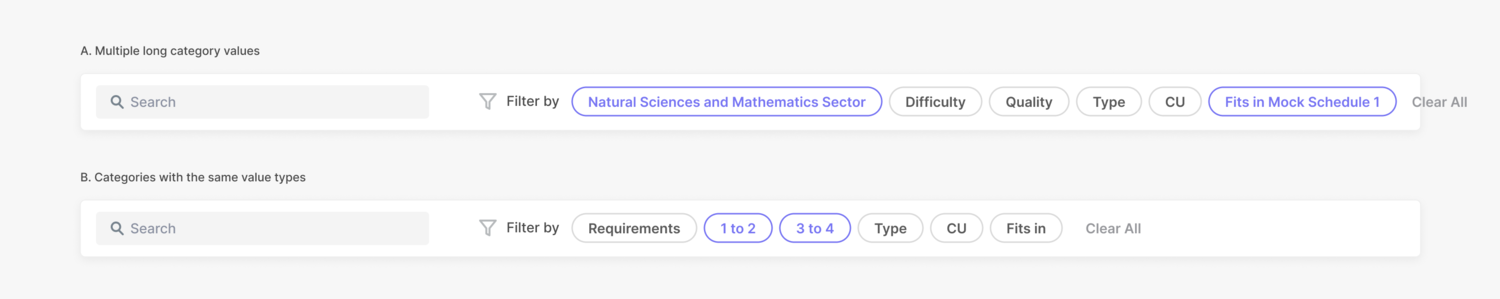 Google Fonts replaces category labels when one value is selected, but not multiple. In all cases, changing in the filter background color and addition of the X button make it clear to the user which filters have been applied. I explored a similar approach for Penn Course Plan’s filters.
 This design resolves the usability issues from the previous iteration. Although selected filter values are not readily displayed in this design, users found the distinct interactive states sufficient for conveying this information.
Filter category dropdowns
I designed dropdowns for the current filter categories: school requirements, section type, and course units. I added filters for course difficulty and quality ranges, based on Penn Course Review data.
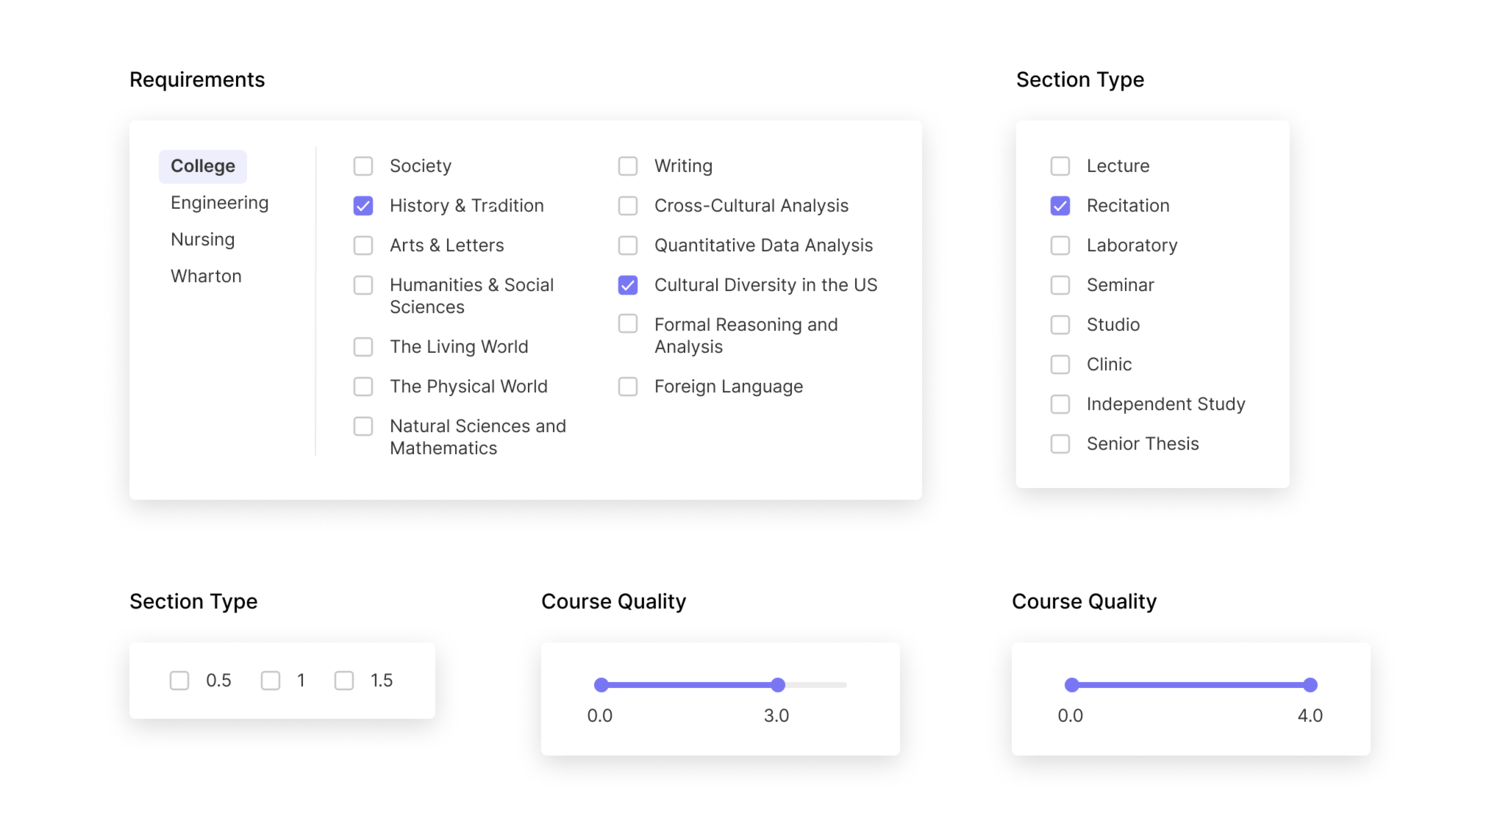 Additional filters I considered including were time range, open/closed status, and compatibility with the selected mock schedule. These were not technically feasible to implement before launch.
Clarifying the empty state
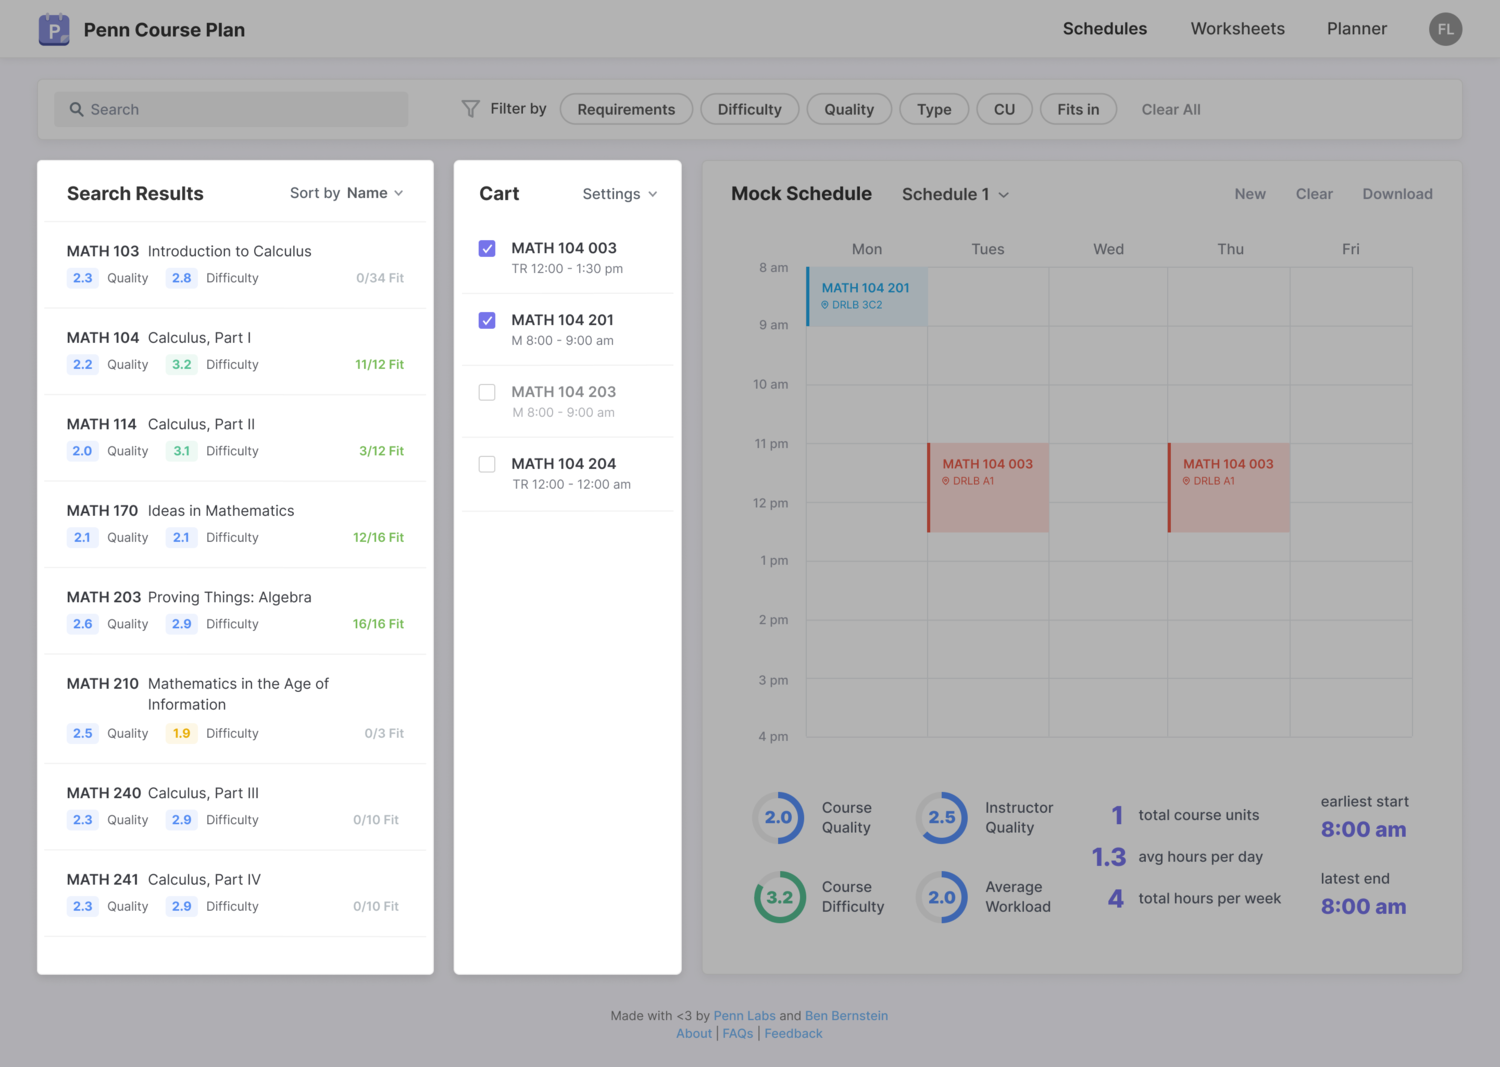
I also designed an empty state for when applied filters cause the search query to return no results. The distinct illustration and guiding copy clarify the situation.
Course and Section Information
Displaying the details for each course was the biggest challenge in the redesign. From user research, I learned about the many factors students take into consideration while choosing their courses.
On Penn InTouch, section details are displayed in a dense horizontal table with modals for additional information.
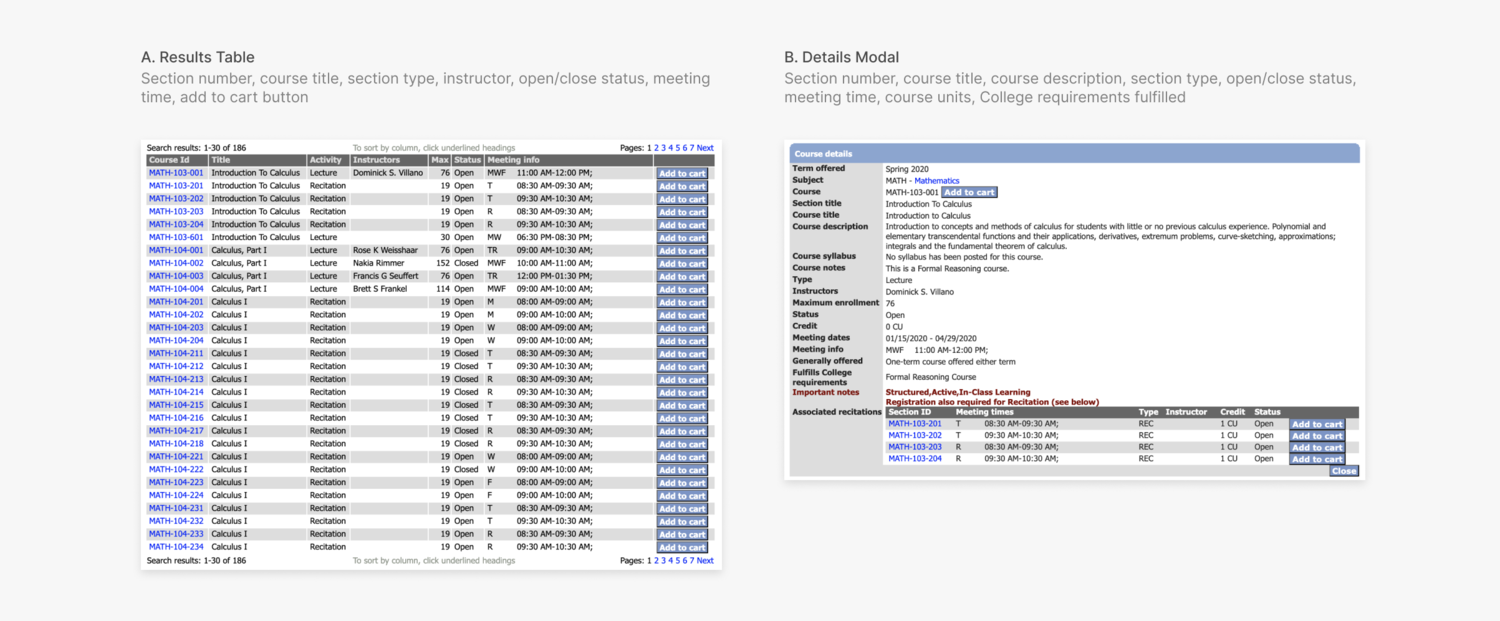 On Penn Course Search, the course and section information are displayed in two separate panels. The section panel contains a table with a row for each section, showing additional details when clicked.
 For both Penn InTouch and Penn Course Search, it takes at least three clicks across two different areas to uncover all the details students use to make an informed decisions about courses.
My strategy was to condense course information into simple table cells while maintaining pertinent details. I focused on establishing visual hierarchy and scanability.
Course search flow
For each course at Penn, there are several associated sections (i.e. lectures, labs, and recitations) that students can choose from.
When users enter a general search term (i.e. “CHEM” or “algorithms”) the search results will include summarizing parameters relevant to all sections of the course.
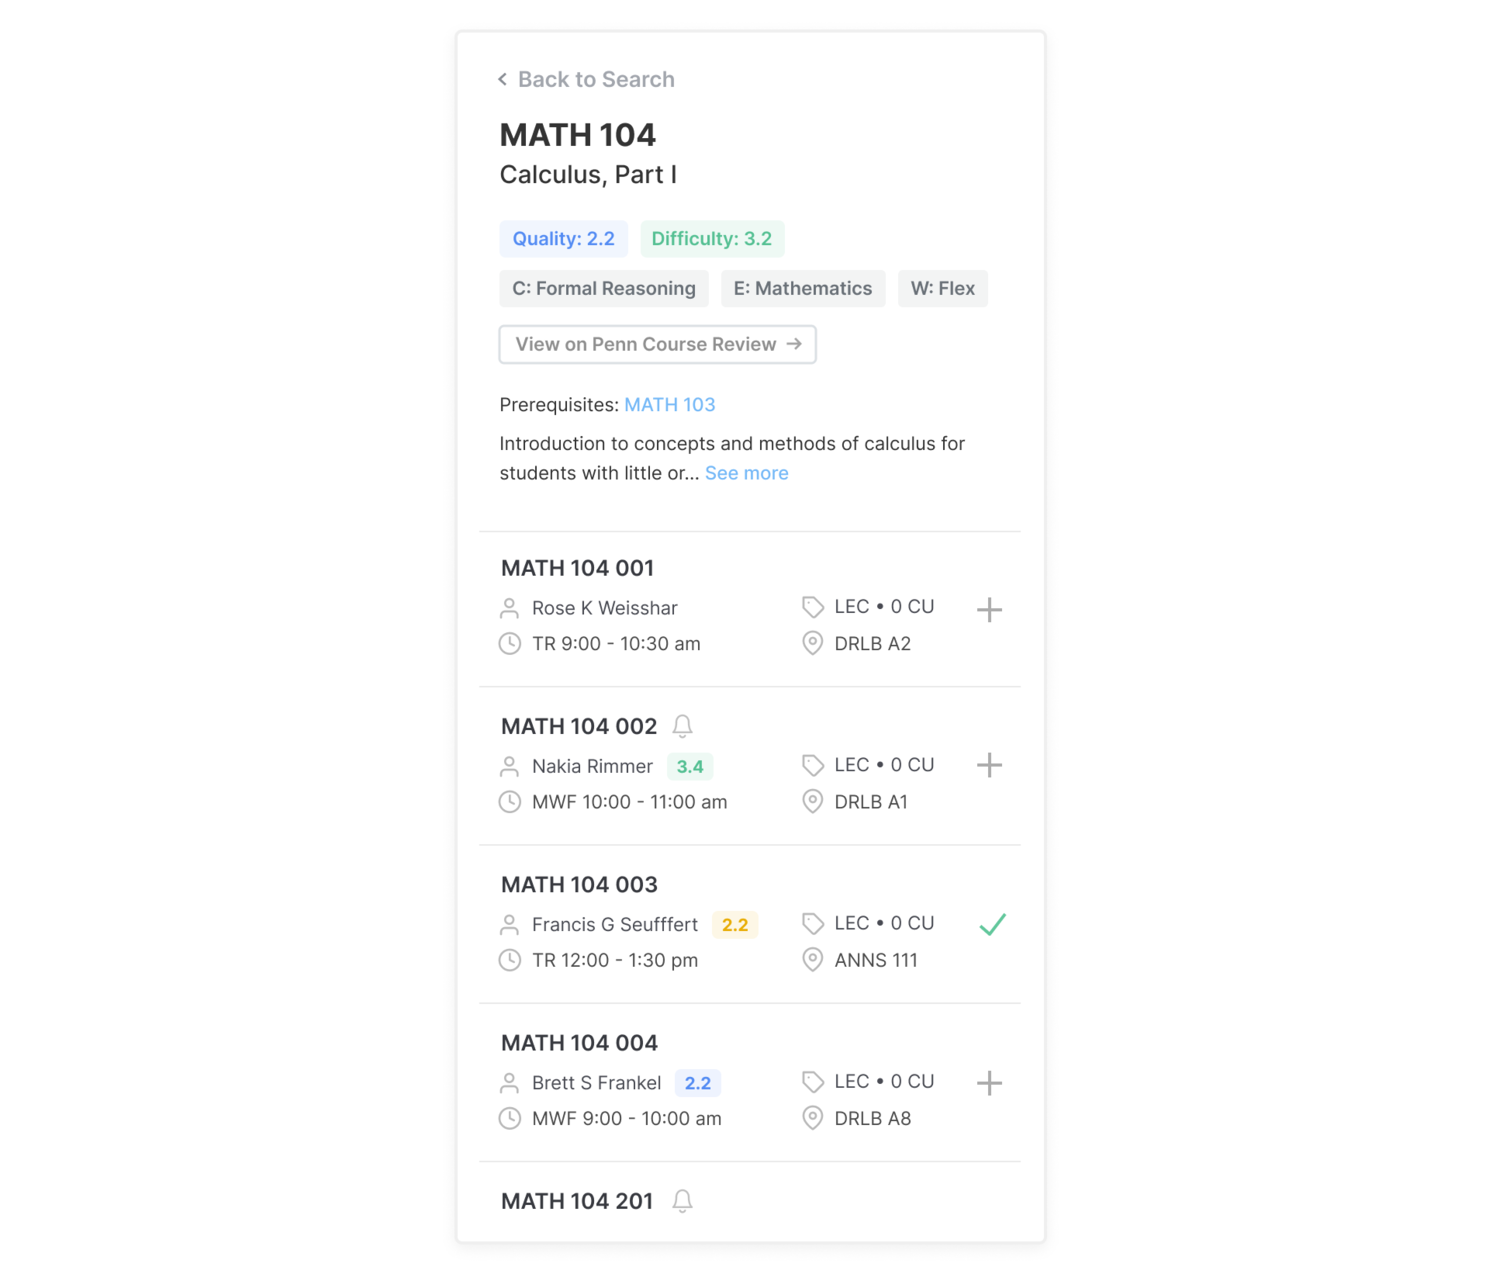
When users click on a general search result, or if they enter a specific search term (i.e. “CHEM 101” or “Introduction to Algorithms”) they will be shown more details about the course, as well as information on the individual sections.

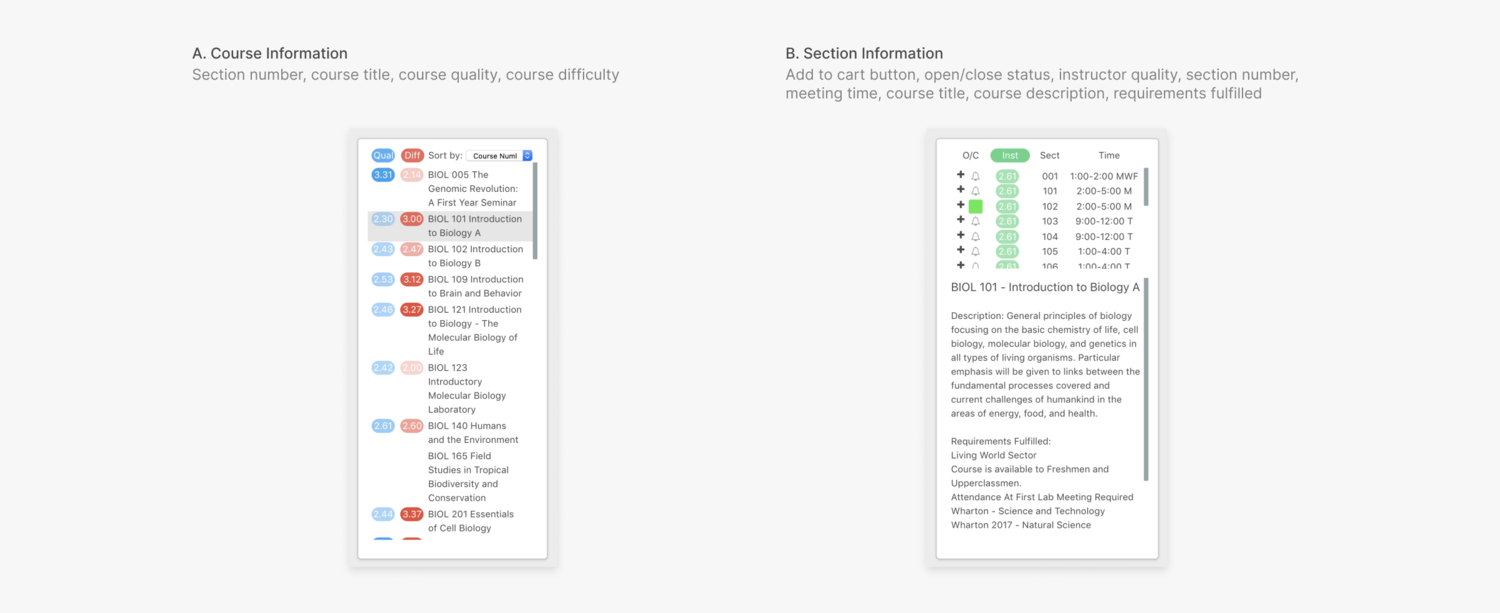
Course summary view
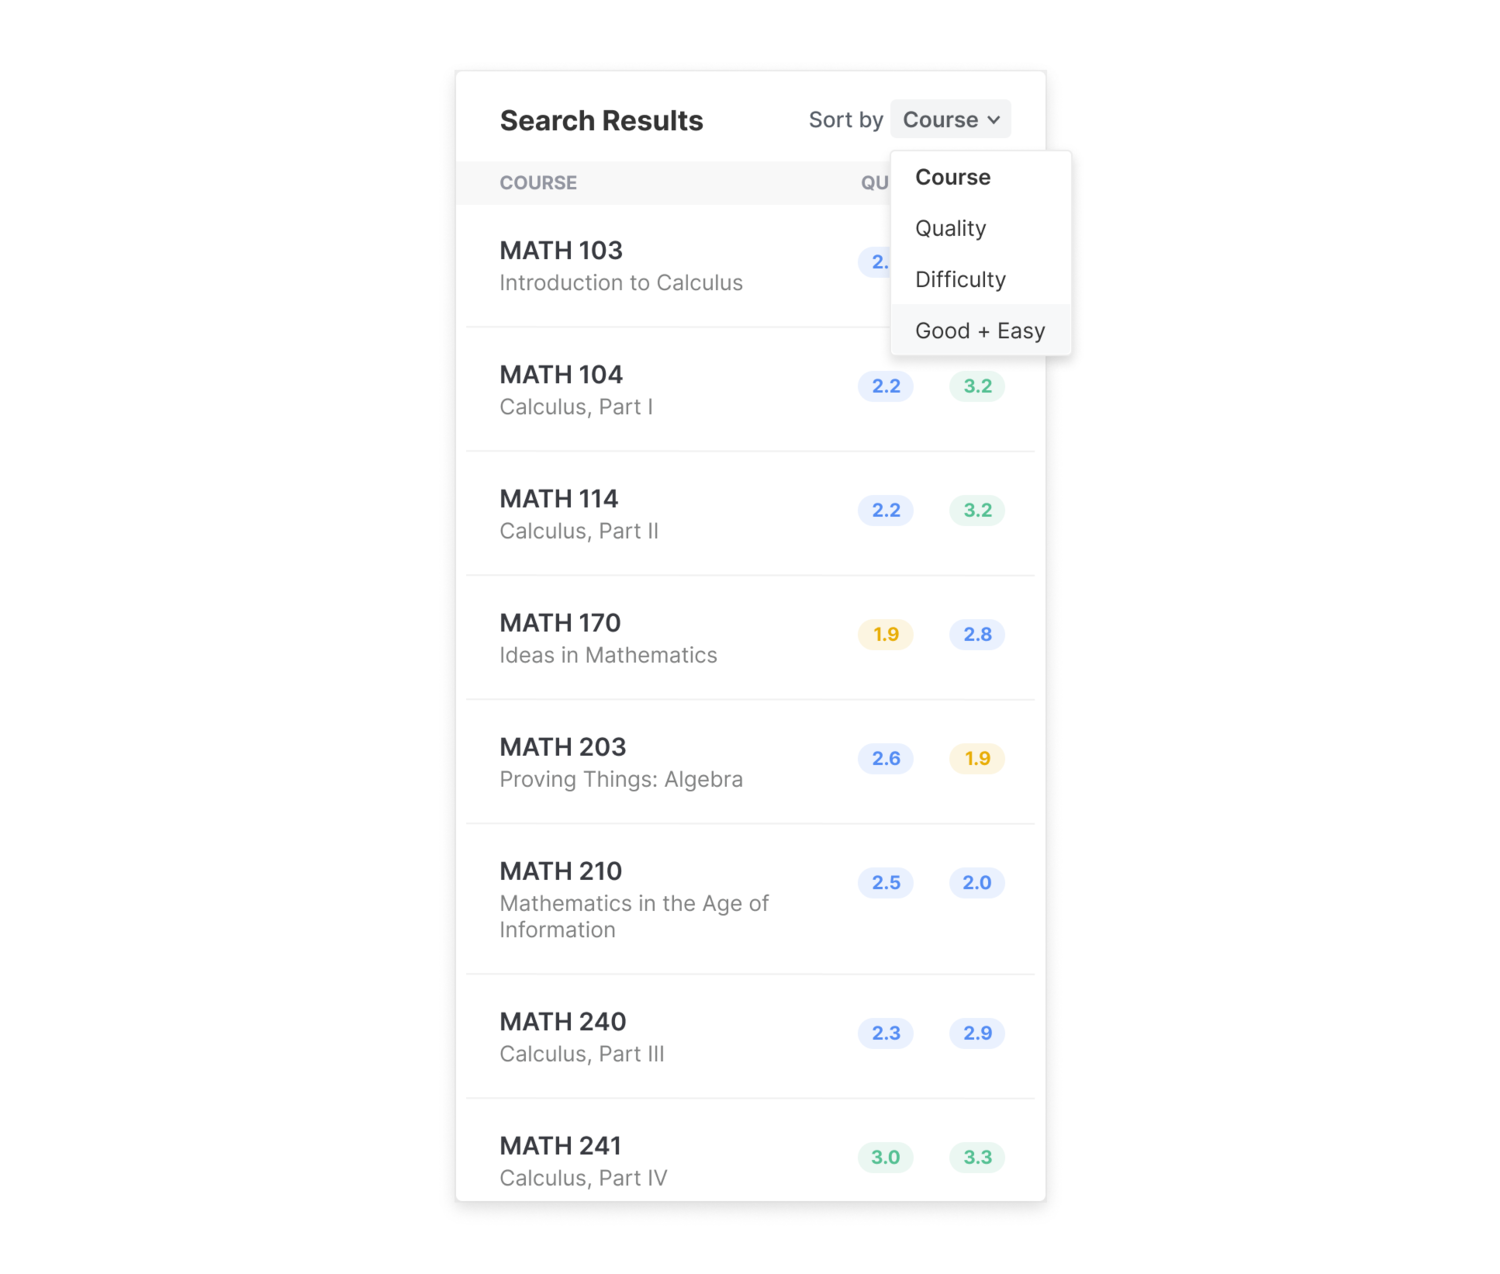
I started by designing the general search results, which display information relevant to all sections of the course: course number, course title, quality, difficulty.
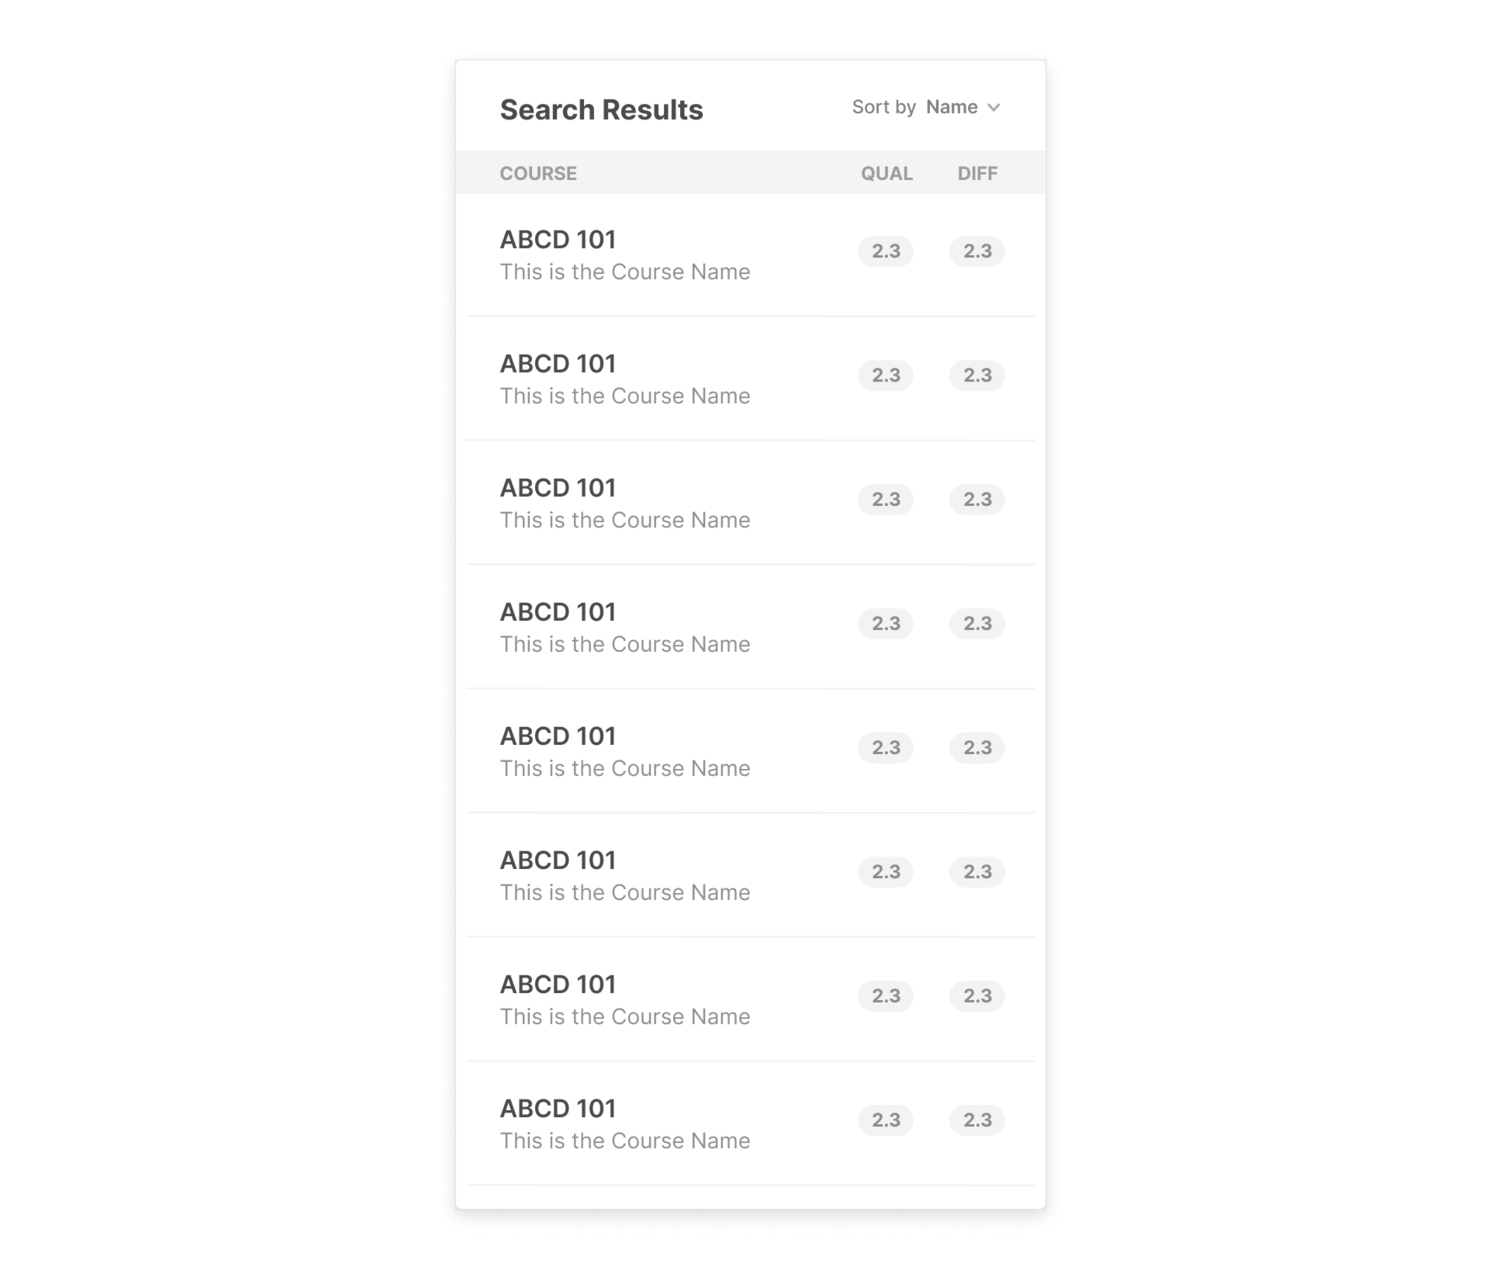 A key design decision I made was to change the visualization of the quality and difficulty metrics to be consistent with Penn Course Review’s color system.
 A is based on Penn Course Search’s system, which uses opacity to denote quality and difficulty levels (low rating = low opacity, high rating = high opacity).
B is based on Penn Course Review’s system, which uses three discrete colors to represent three levels (low, medium, and high).
In C, I considered using green for high quality/low difficulty and red for low quality/high difficulty, since many students are actively looking for good and easy courses. However, I was told that the University administration took issue when PCR considered doing this in the past, since they were concerned that users would associate green with good and red with bad.
I went with B, since I found that users could more easily distinguish between the different colors used by PCR than the different opacities used by PCS. To account for this tradeoff made by forgoing** C**, one of the developers implemented a “good and easy” sort to rank the results by descending quality and ascending difficulty.
Section details view
I then designed the section details display. This view contains the entry point for additions to the course cart.
I first divided the section information methodologically based on whether the parameters were relevant to all sections or if they were specific to individual sections.
- all sections: course quality, course difficulty, requirements fulfilled, instructor quality, prerequisites, cross-listings, course description
- individual sections: section number, section instructor, instructor difficulty, meeting time, meeting location, open/closed status
I chose to display the information for all sections at the top.
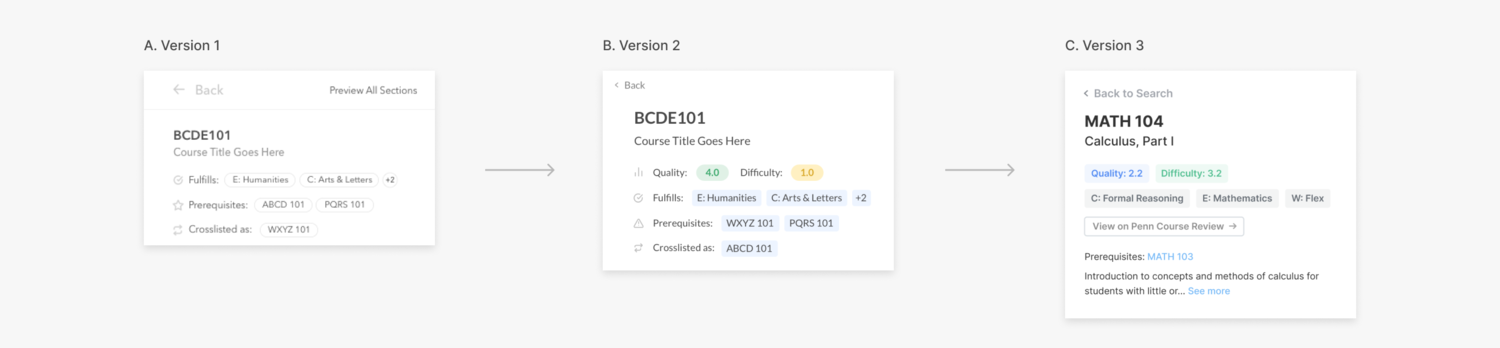 B **includes the course quality and difficulty metrics missing from **A and has a visual style more consistent with the rest of the product.
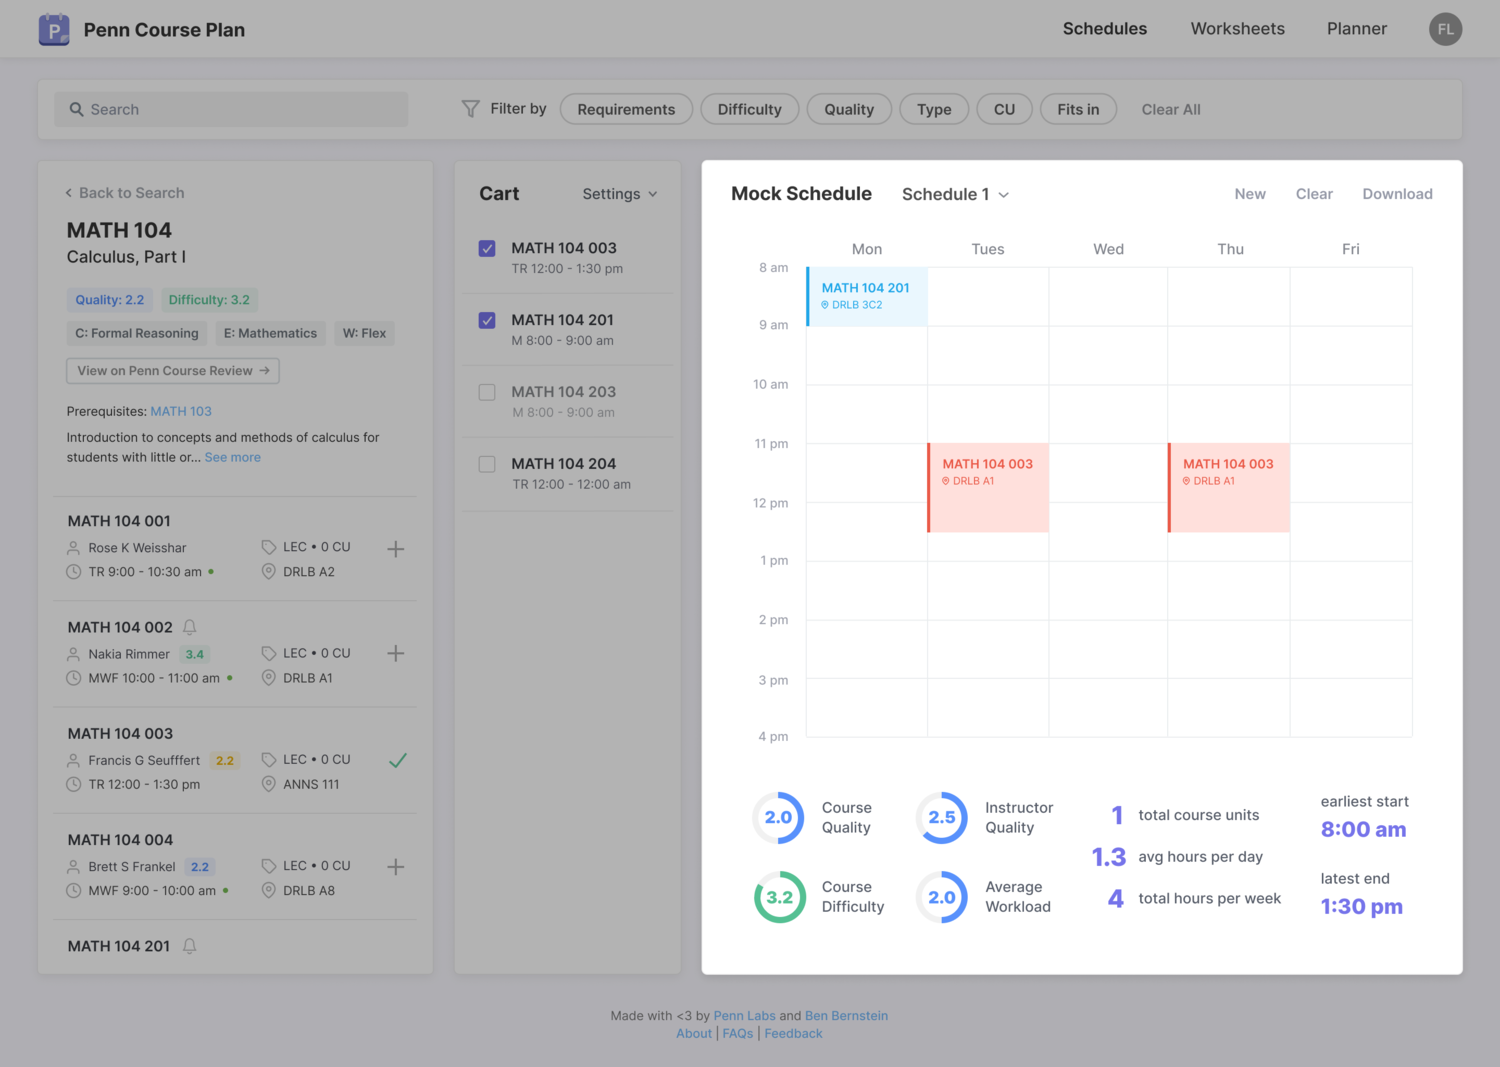
I noticed that users did not realize the prerequisites and cross-listings were clickable in B, so I transformed them into links in C. Since quality, difficulty, and requirements fulfilled are not clickable, I transformed them into tags. I also added a link to the course’s Penn Course Review page and a collapsed course description below.
Information for individual sections is displayed below the information for all sections. I explored two alternatives for this table.
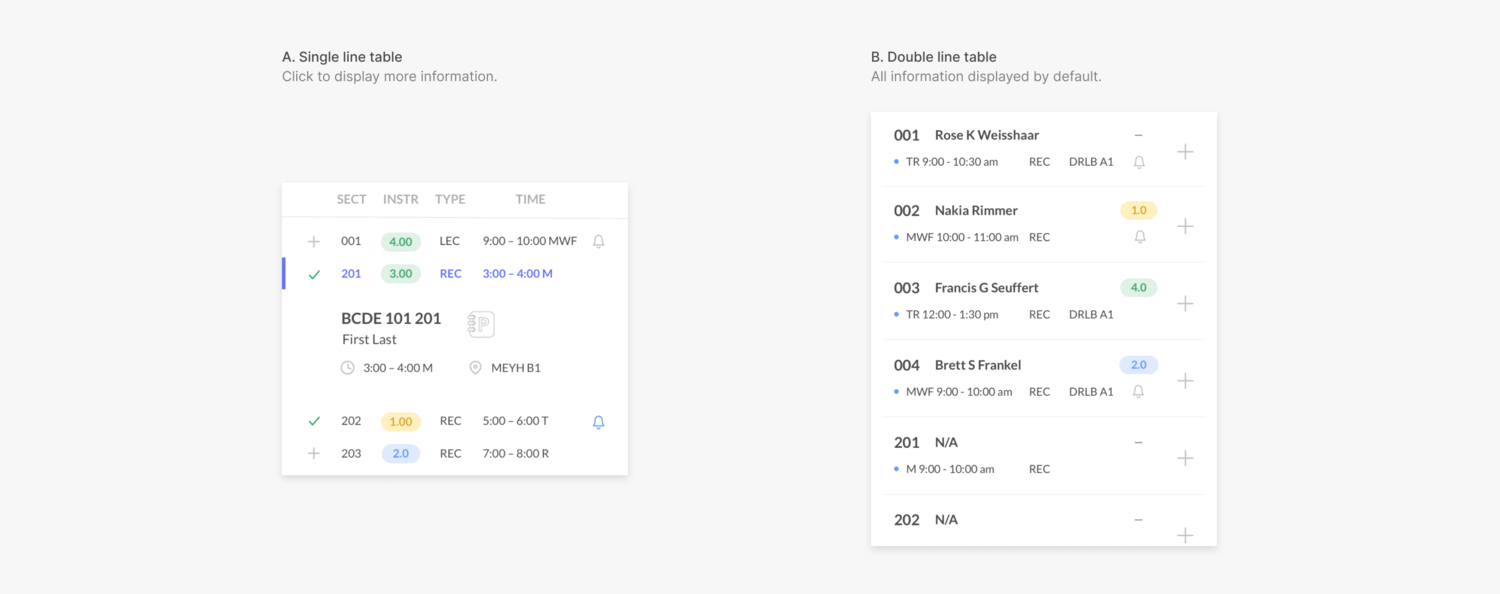 A displays most of the section details in a single line table, with additional information (i.e. section instructor, meeting location) displayed when a section is clicked.
**B **displays all the section details in a two-line table. Section number and instructor are highlighted in the first row and all other details are placed below.
From user testing, I learned that people found the extra click view additional section information in A to be a nuisance. They preferred seeing the expanded view for all sections as the default in B.
 In this view, section number and instructor are emphasized. However, referring back to what I learned from users, many other factors (meeting time, section type), were just as—if not more—important to them.
I was also surprised to learn that users found it difficult to locate instructor name, although it was the most visually emphasized parameter. To resolve this confusion, I added icons to label each parameter. Additionally, I moved the instructor quality badge next to instructor name and moved meeting time next to meeting place.
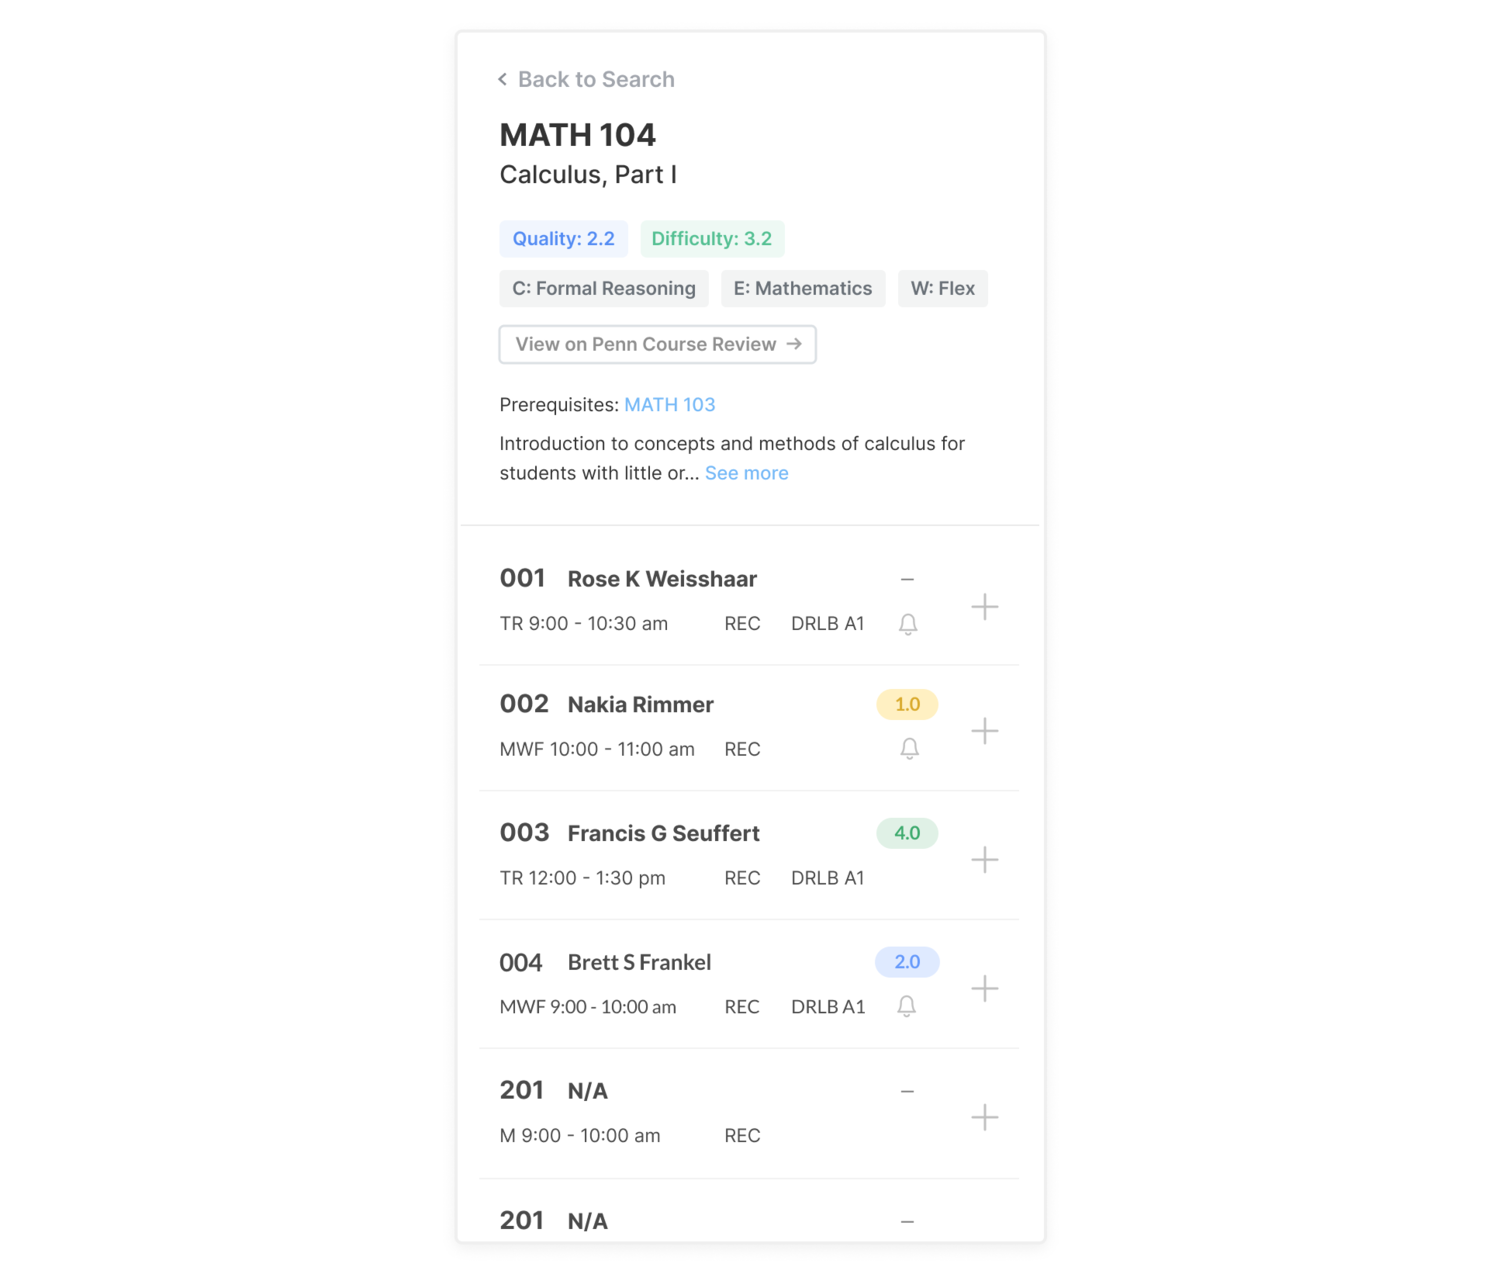
I adjusted the table to display the full course code (not just the section number) in bold, since users enter the full code when they register for courses on Penn InTouch.
Mock Schedules
After users add course sections to the cart, they can then build mock schedules with the added sections.
Mock schedule management
In the current interface, all of the mock schedule functionalities are collectively hidden in a dropdown in the navigation bar.
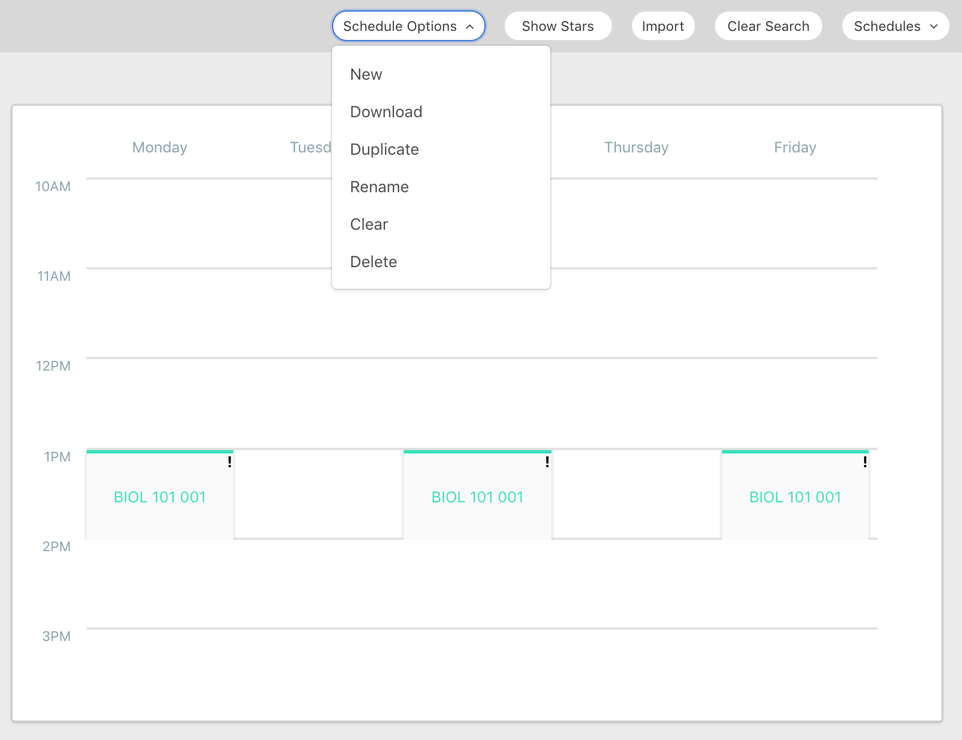 To increase the visual prominence and accessibility of these options, I first experimented with displaying all the functionalities across the top of the schedule.
 However, I found it overwhelming and unhelpful see all the features all the time. I decided that a dropdown of some sort would be necessary to organize the features.
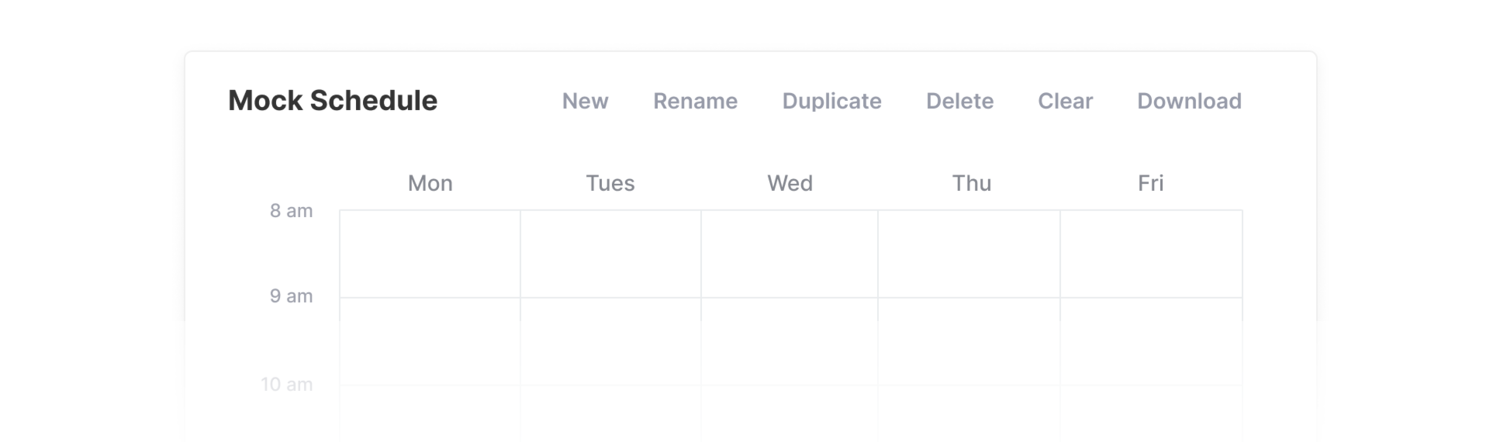
To better organize the mock schedule features, I categorized them based on their use cases:
- Clear **/ import / download** (used during or after the creation of new mock schedules) are placed above the current mock schedule, displayed while the user is viewing the schedule in view.
- New **/ rename / duplicate / delete** (used while editing or creating mock schedules) are condensed in a dropdown, displayed when the user hovers over a specific schedule.
 From user testing, I learned that many users did not know how to make multiple mock schedules in this design, since the action was nested in a small arrow next to the title of the mock schedule.
Instead of using the mock schedule name as the section header, I decided to use “Mock Schedule” as the default header. I increased the size and prominence of the dropdown by placing the mock schedule name beside it. I also added a new schedule button outside this dropdown.
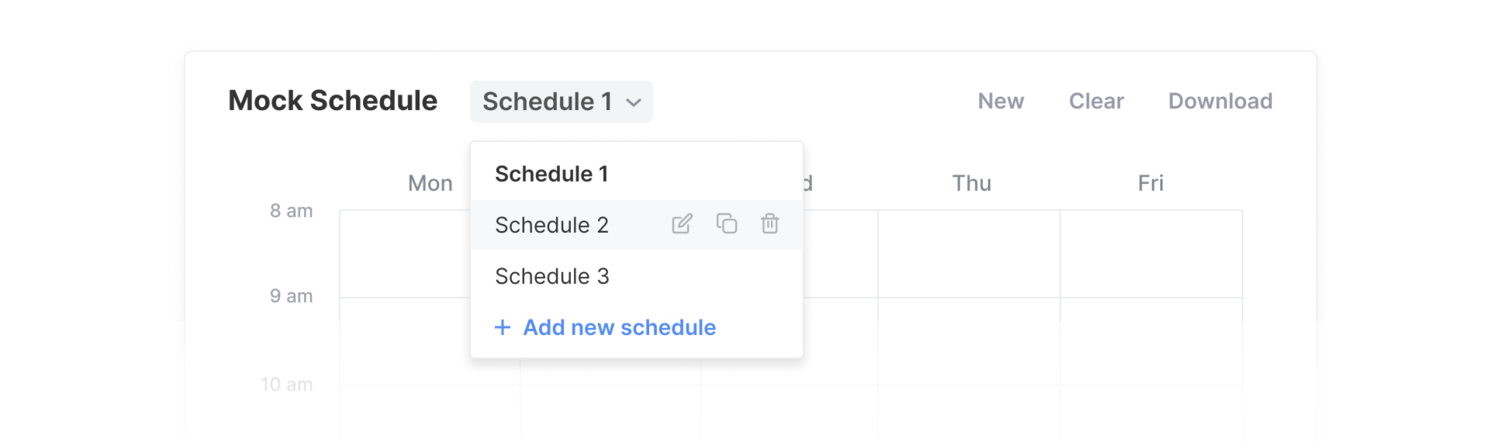 We plan to do A/B testing to see whether this design will increase creation of multiple mock schedules.
Schedule statistics
The team lead and two developers were working on implementing relevant statistics for each mock schedule. I decided how to best visualize this data.
For the course review metrics (course quality, course difficulty, instructor quality, average workload), I explored two alternatives.
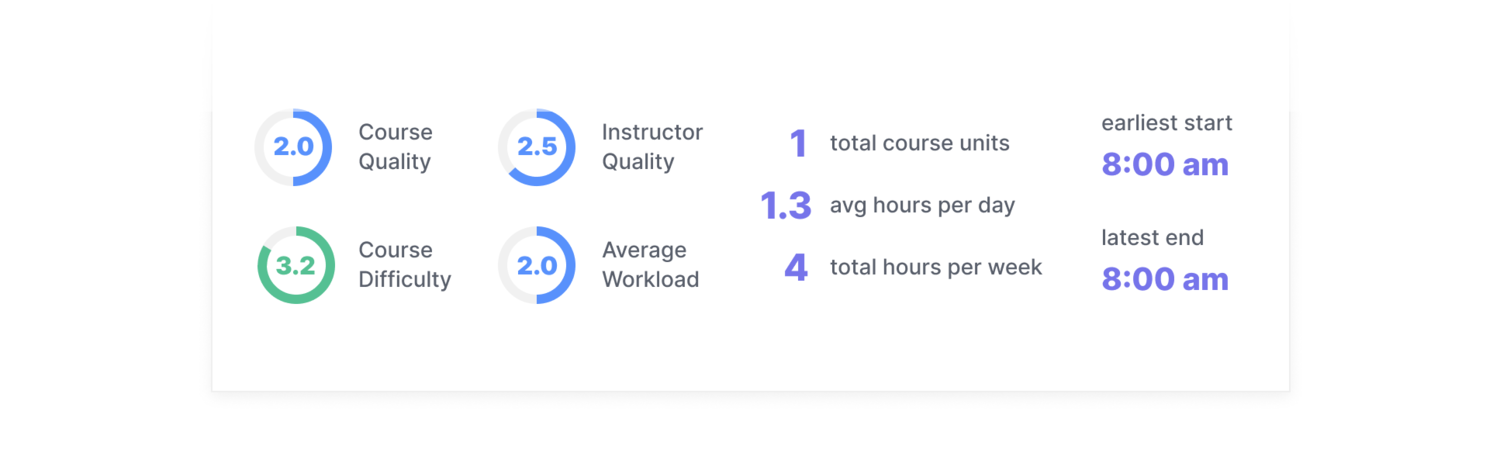
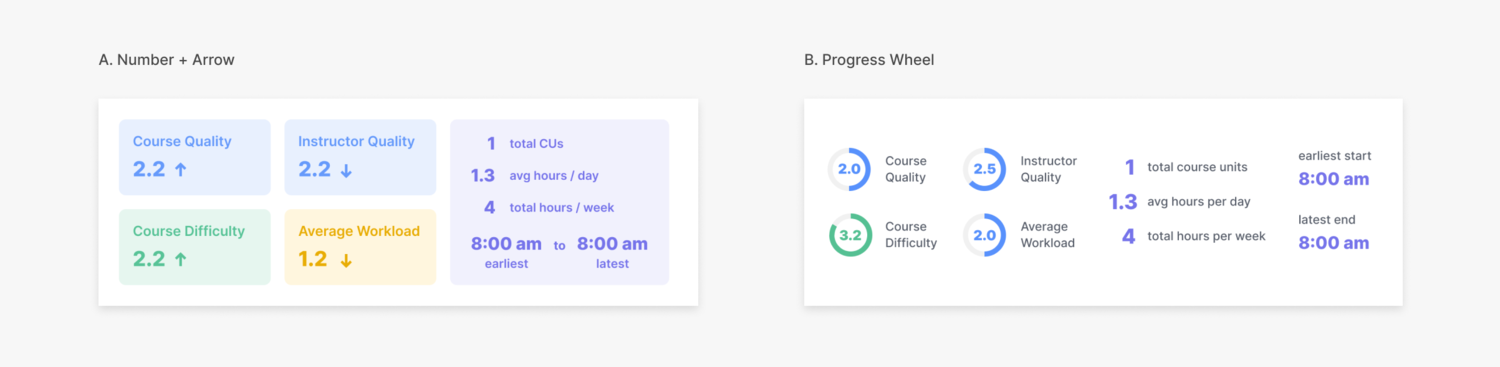 A shows the number only, with arrows to reflect changes. **B **shows the number with a circular progress wheel. At first, I thought the wheel might be providing redundant information, but I learned that users found it helpful to see changes in the wheel after adding/removing sections from their schedule.
REFINING THE DETAILS
Integration with the Penn Courses ecosystem
One of the key business goals for this redesign was to better integrate Penn Course Plan with the rest of the Penn Course products.
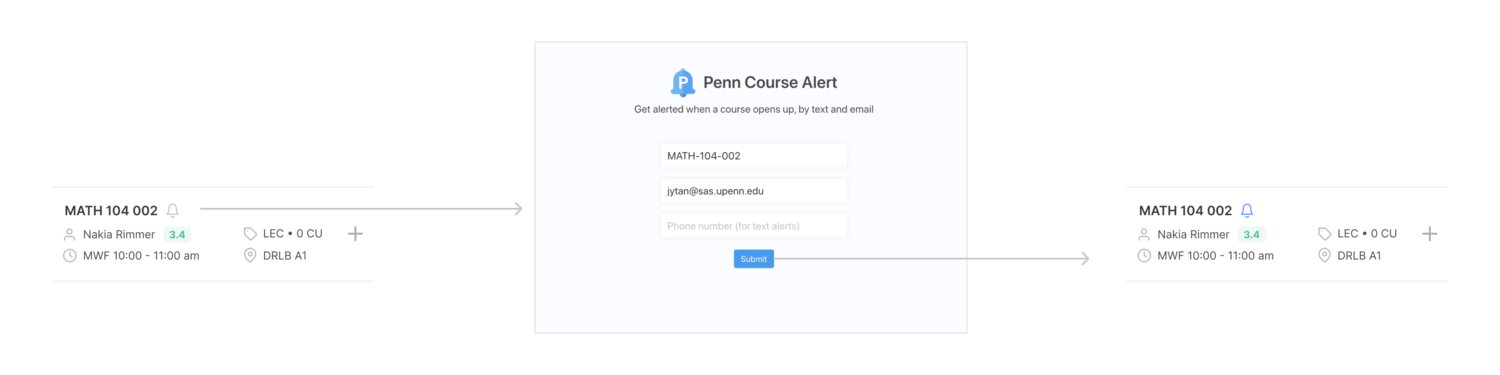
Penn Course Alert
Penn Course Alert allows users to sign up for email and text alerts for closed sections. In the redesign, the bell symbol in the section details view indicates the section is closed.
Clicking the bell redirects users to Penn Course Alert, with the fields auto-populated with the section information. A blue bell indicates that a section is closed and the user is currently already signed up for alerts.
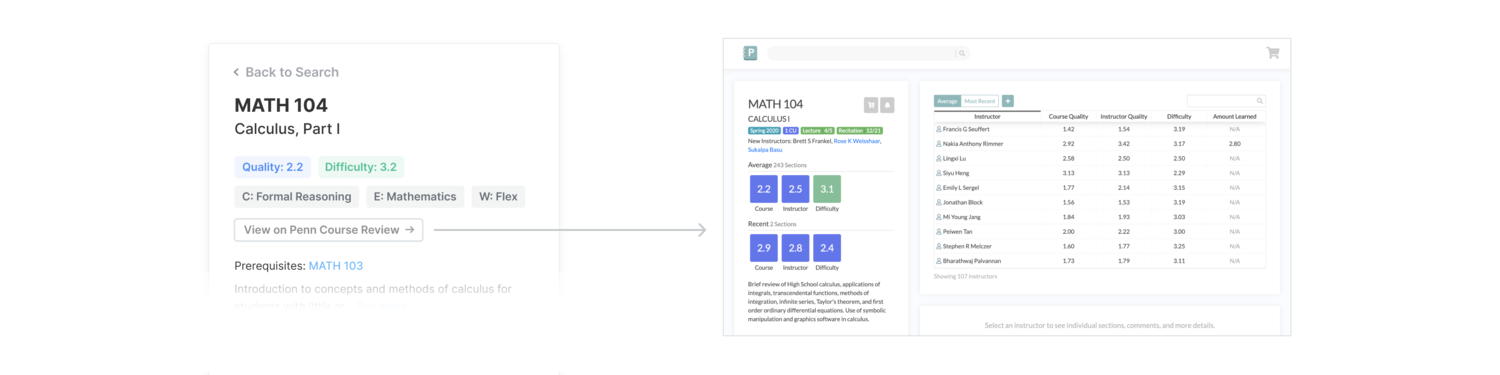
Penn Course Review
Penn Course Review provides extensive student rating data throughout the years. Because this data did not fit within the space and technical constraints of Penn Course Plan, the Penn Labs directors made the executive decision to keep the two products separate.
I added a button inside the course overview as an entry point for the corresponding Penn Course Review page.
Improving clarity
Empty states
I created branded empty state illustrations for each section and provided instructional cues. The copy encourages engagement with the product and reduces confusion.


Tool tips
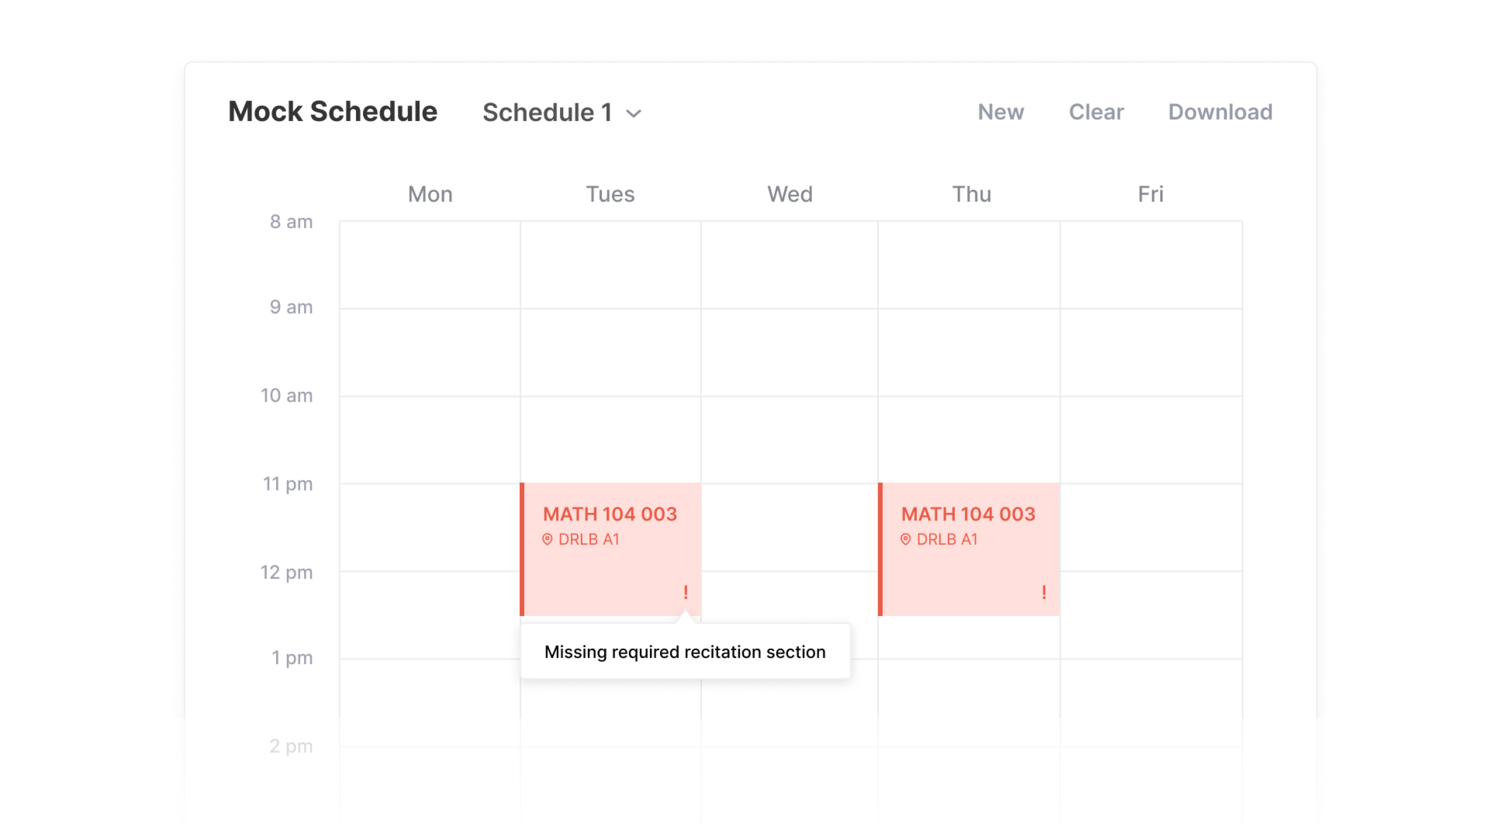
In addition to empty states, providing guiding information through tool tips clarifies any ambiguities and informs users of any errors.
For example, to ensure users add all the required sections for a course to their schedule, there is a warning icon with a tooltip to let users know if they’re missing the co-requisite section.
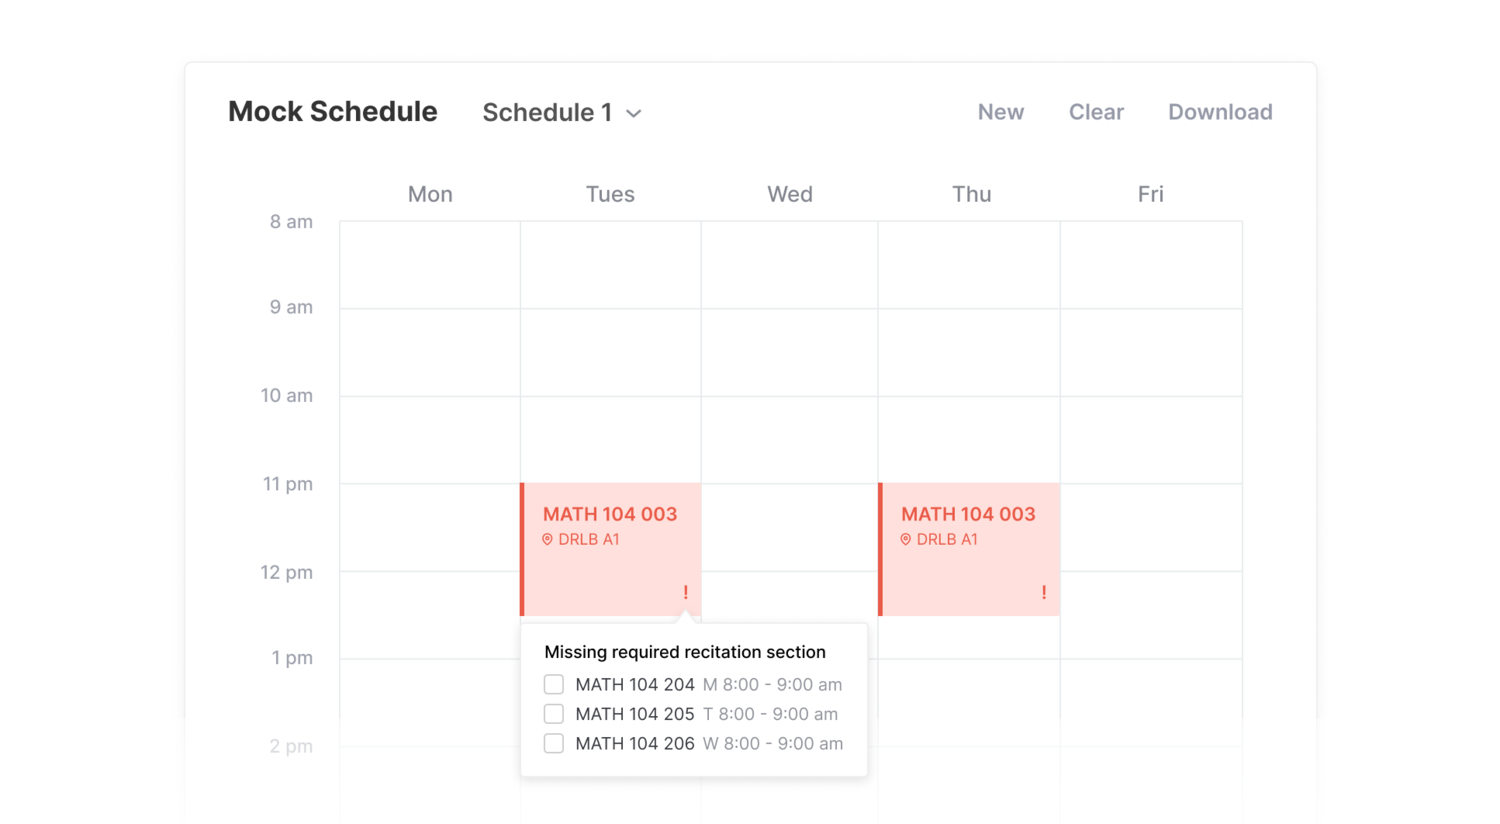
 When the tool tip is clicked, users have the option to add missing sections in the cart directly to the schedule. If the section is not yet in the cart, the section gets added to both the cart and the schedule.
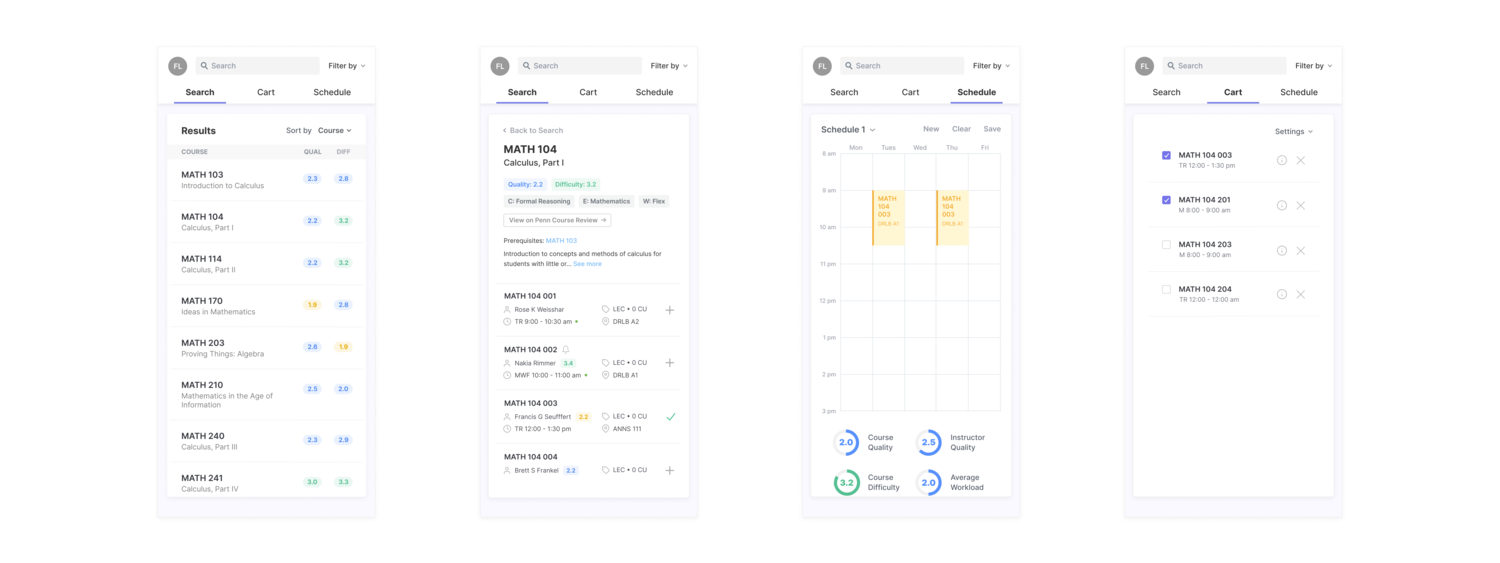
Making it responsive
I designed mobile and tablet layouts to make searching and planning accessible on devices and windows of all sizes. I decided that a tabbed navigation would be the best way to navigate through the search, cart, and schedule on smaller browser windows.
Reflect
IMPACT
By the numbers
We successfully launched this redesign late October 2019, prior to the advanced course registration deadline at Penn.
The product garnered nearly 2,000 unique users within a week of launching, with nearly all users reporting that Penn Course Plan is more user friendly than PennInTouch, the current course registration software.
Throughout the spring course registration process, there have been 8,000 users, many participating in multiple sessions.
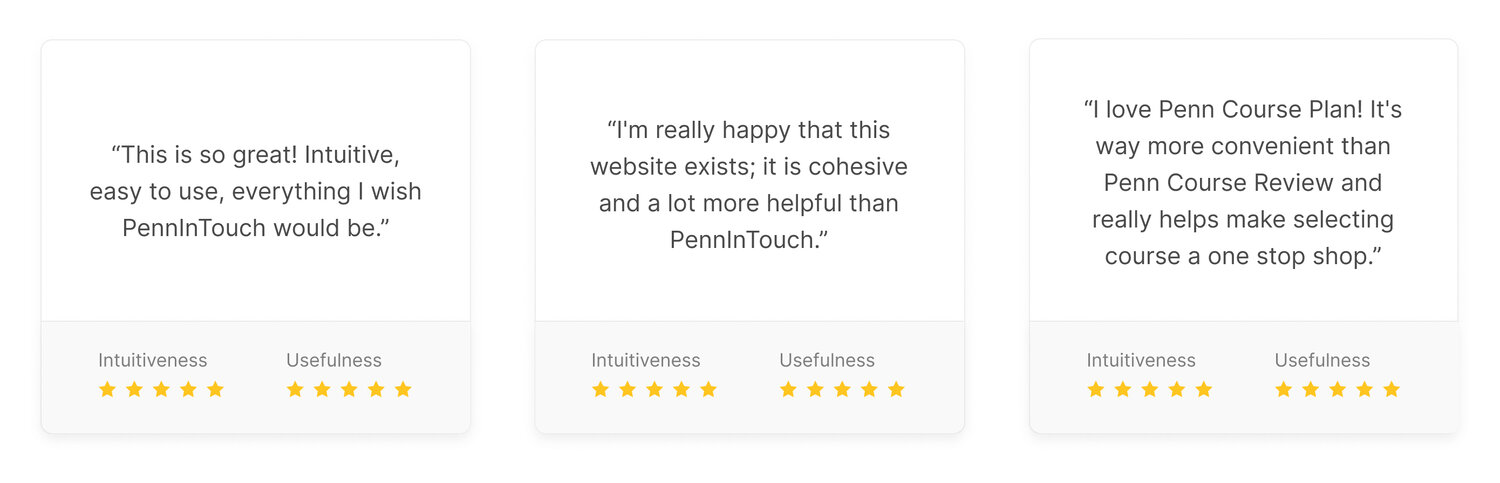
Testimonials
My team and I received many personal messages from friends, expressing their gratitude to Penn Labs for making this product. We also received several testimonials from our anonymous feedback form at the bottom of the site:
LEARNINGS
Challenges
This was my first major product design project, and I definitely learned a lot while working with my team to execute the design. A few of the key challenges I faced include:
- setting aside my own assumptions about user behavior and needs
- making significant alterations based on recurring user feedback
- fitting a large amount of information within a single page, no-scroll app
- accounting for the many potential edge cases
Next Steps
As new technical constraints, user concerns, and business goals are uncovered, we’re continuing to fix bugs, enhance functionality, and identify areas of improvement. Some of the next steps the team and I have planned include:
- conduct further user research to understand the full course planning cycle and timeline
- use A/B testing to see what designs increase the creation of multiple schedules
- modify the course cart deletion process to reduce confusion
- make it easier to compare metrics across schedules
- add course planning worksheets and 4 year academic planner
Moving forward, we will be iterating off feedback and making informed design decisions based on user data. We will be expanding to include new features that allow for long-term planning. I’m looking forward to diving deeper into the course planning problems students at Penn face and working with my team to address those pain points.
Conclusion
Designing for Penn Labs has been an extremely rewarding and educational experience. As a student designing a product for other students, I had the opportunity to learn about the course planning pain points and experiences for a wide variety of students.
Working closely with several software engineers and business developers taught me how to design based on user insights, technical constraints, and business goals.
This redesign project was my first time working through the entire product cycle, from ideation to delivery. I can’t wait to continue improving and expanding Penn Course Plan as we continue to hear feedback from the Penn community!